
RUSSIAN JOURNAL OF EARTH SCIENCES, VOL. 19, ES2008, doi:10.2205/2019ES000658, 2019
V. V. Sivkov1,2, L. D. Bashirova1,2, E. V. Dorokhova1, M. V. Kapustina1,2, E. P. Ponomarenko1,2
1Shirshov Institute of Oceanology RAS, Moscow, Russia
2Immanuel Kant Baltic Federal University, Kaliningrad, Russia
The sediment drift north of the Kane Gap has been investigated by means of the seismoacoustic profiling. The surface area of the drift is about 500 km$^2$ and maximal thickness is 70 m. The contourite drift was formed under the control of the Antarctic Bottom Water (AABW) flow in the Kane Gap. It is suggested naming this contourite fan as the "Kane Drift". Variations in the activity of the AABW current were registered in the sediment core ANS-33056, retrieved near the summit of the drift. For this purpose, the mean size of sortable silt ($\overline{SS}$, mineral fraction 10–63 $\mu$m) was used. It was shown that during the Mid-Pleistocene to Holocene, the speed of the AABW flow north of the Kane Gap was not strictly determined by the alternation of the climatic cycles. A strong relationship between the AABW flow and the short-time climatic fluctuations was found only during the marine isotope stages (MIS) 4 and 5: intensification of the near-bottom current coincides with the cold intervals. Moreover, during the Terminations II and I (MIS 2/1 and MIS 6/5, respectively), the intensity of the current also increased. Maximal near-bottom current activity was registered at the end of the MIS 2.
During the Middle to Late Quaternary, significant variation in activity of the global thermohaline circulation influenced by the glacial-interglacial alternations was registered. The intensity of the near-bottom currents was also varying. This has determined the volume of the Antarctic Bottom Water (AABW) entering the North Atlantic [e.g. Johnson and Rasmussen, 1984; Ledbetter, 1979; Lund et al., 2011]. The main part of the AABW, the densest water mass in the World Ocean, circulates from the Weddell Sea to the north along the bottom of the deep ocean basins of the West Atlantic. Studies on the reconstruction of the past AABW flow regime are focused on the main AABW routes in the West Atlantic. However, little is known about the history of the AABW (and its modifications) circulation in the East Atlantic.
Relatively narrow deep channels and passages control the exchange of deep water between the ocean basins. Here, the intensity of the near-bottom currents increases. In contrast, at the downcurrent exit of the channels, they slow down and unload. As a result, the sediment bodies named the contourite fans are deposited there [Rebesco et al., 2014].
Sierra Leone Rise, which is situated between the Mid-Atlantic Ridge (MAR) and Africa, is the main obstacle for the deep water spreading towards the East Atlantic. The Kane Gap (a narrow deep-water channel), is the only possible gateway which allows the exchange of AABW between the Sierra Leone and Gambia Basins [Egloff, 1972].
West of the Kane Gap and north of the St. Paul Fracture Zone (near 3° N), a sedimentary body was identified. Jones and Okada [2006] suggested naming this Cenozoic sedimentary body as "the Guinea Drift". The seismoacoustic profiling data obtained during the 32nd cruise of the R/V Akademik Ioffe (2010) allowed identifying another sedimentary body directly adjacent to the Kane Gap from the north [Levchenko and Murdmaa, 2013]. We suggest that it could be a
contourite fan which has been formed by the AABW flow. It is known that sedimentation rates on the drifts are high, in comparison with adjacent pelagic sediments. Therefore, like typical contourites, the sediments of the fan are of particular interest for studying the ocean thermohaline paleocirculation [Jones and Okada, 2006; Rebesco et al., 2014].
During the 33rd cruise of the R/V Akademik Nikolay Strakhov (2016), north of the Kane Gap, an additional seismoacoustic profiling was carried out [Sivkov et al., 2019].
The present study aims to evaluate horizontal and vertical dimensions of the sedimentary body formed by the AABW flow using the seismoacoustic data. It also aims to trace variations in near-bottom current intensity during the Mid-Pleistocene to Holocene based on the grain size data.
|
| Figure 1 |
The data are obtained using multibeam echo sounder RESON SeaBat 7150 (12 kHz) and seismoacoustic sub-bottom profiler EdgeTech 3300-HM (2–6 kHz) (Figure 1). ANS-33056 marine sediment core (09° 33.68$'$ N, 20° 00.80$'$ W, 4543 mbsl, 5.13 mbsf) was retrieved during the 33rd cruise of the R/V Akademik Nikolay Strakhov (2016),
near the summit of the sediment drift. The core section was sampled onboard with 1 cm step. Grain size and micropaleontological analyses, as well as
CaCO$_3$ and the total organic carbon (TOC) contents, were carried out onshore, in the AB IO RAS laboratories. Lithological description of the core section was done according to the Myhre et al. [1995] classification. Wentworth grain size classification was applied [Wentworth, 1922]. The boundary between sand and silt is at the 63 $\mu$m, while the boundary between silt and clay – at the 4 $\mu$m.
Sandy silts and clayey silts containing 10–25% calcium carbonate were referred to foraminifera-bearing mud; 25–50% calcium carbonate – to foraminiferal mud; $> 50$% calcium carbonate – to foraminiferal ooze. We used the term non-calcareous (terrigenous) mud for low-carbonate silty clays ($<10$% CaCO$_3$). The grain size analysis was carried out on the laser diffraction particle size analyzer SALD-2300 (Shimadzu, Japan). The grain size of the bulk sediments was used for the lithological description (every 10 cm; 1 cm thick slices).
Mineral part of the sediment was analyzed (every 2–3 cm; 1 cm thick slices). Organic matter and carbonates were removed by treatment with excess H$_2$O$_2$ and HCl, respectively. To disaggregate component grains, sodium tripolyphosphate was added. Then each sample was sonicated with an ultrasonic bath immediately before the analysis. Mean size of sortable silt ($\overline{SS}$, mineral fraction 10–63 $\mu$m), which is sensitive to the current sorting, was used as a proxy for measuring a near-bottom paleocurrent intensity. An increase in the $\overline{SS}$ indicates the strengthening of the near-bottom current [McCave et al., 1995].
The micropaleontological analysis was carried out using the MBS-10 microscope. Carbonate shell preservation and presence of foraminifera in $>100$ $\mu$m fraction (every 5 cm; 1 cm thick slices) were studied. Some planktonic foraminiferal species were used as the biostratigraphic markers.
The CaCO$_3$ (every 2 cm; 1 cm thick slices) and TOC (every 10 cm; 1 cm thick slices) contents were obtained using an AN-7529 express analyzer by means of the coulometric method. The carbonate content was calculated from the C$_{\mathrm{carb}}$ with a coefficient of 8.3.
Marine isotope stages (MIS) were assigned using the CaCO$_3$ content that reflects the glacial-interglacial alternation [Barash, 1988; Helmke and Bauch, 2001]. The relative abundance of CaCO$_3$ has the same trend when compared with a standard stable isotope curve LR04 [Lisiecki and Raymo, 2005]. Additionally, the study uses the data on the TOC distribution in the sediments. This is also one of the main indicators of upwelling [Seibold, 1982]. It is well-known that the Canary upwelling (the area near northwestern Africa) has strengthened during the cold intervals of the Pleistocene. Thus, during MIS 2, its boundary was shifted to the south up to 14° N [Barash, 1988].
 |
| Figure 2 |
Previously, three echo-facies were identified at the exit of the Vema Channel during the study of the AABW flow fan [Faugères et al., 2002]. We have compared our data on the seismoacoustic profiling with these echo-facies (Figure 2):
 |
| Figure 3 |
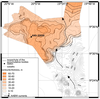
The multibeam echo sounder data allowed building up a digital model of the bottom topography (Figure 3). This model provides a more detailed image of the bottom topography, in comparison with existing maps ([Hobart et al., 1975; Smith and Sandwell, 1997; IOC, IHO, BODC, 2003], In particular, the coordinates of the sill in the Kane Gap (9° 24.5$'$ N, 19° 52$'$ W) and its maximal depth (about 4525 m) were specified. Following the thalweg of the studied Kane Gap, we have also specified the position of the axis of AABW flow.
According to Faugères et al. [2002], echo-facies I indicates the high speed of the near-bottom current. However, in the studied area, the presence of this echo-facies (acoustic basement without sediments) is linked to the slow sedimentation or non-deposition, and even denudation. Based on the position of the echo-facies II and III, the sediment drift north of the Kane Gap has been contoured on a first approximation. The sediment thickness was estimated (Figure 3).
The difference in the sound speed in the water column and the sediment was not taken into account when estimating the drift thickness. A sound speed of 1500 m/s was applied. The maximal drift thickness (the depth to Eocene acoustic basement [Emelyanov et al., 1990, Jones and Okada, 2006]) exceeds 70 m. The surface area of the drift is about 500 km$^2$. The drift has been accumulated to the left of the axis of AABW flow. Near the axis, the slope is relatively steep, especially at the exit of the Kane Gap. On the opposite side, the drift slope flattens out.
In the Northern Hemisphere, influence of the Coriolis force determines the position of the drift to left of the contour current, as well as asymmetry of the drift [Rebesco et al., 2014]. Presence of these morphological features in the studied sediment drift, as well as the proximity of the AABW current indicates its contourite origin. We suggest naming this drift as "the Kane Drift".
It should be mentioned that the sediment supply from Africa and Guinea Plateau to the continental slope could cause an increase in the sediment thickness outside the drift in the northeastern part of the study area, to the right of the axis of AABW flow (Figure 3) [Jones and Okada, 2006]. This sediment transport is not influenced by AABW flow.
 |
| Figure 4 |
According to lithological description, ANS-33056 core section is represented by the calcareous and non-calcareous muds of different density and color (Figure 4). Several thin greenish (glauconitic?) interlayers could indicate the slowdown of sedimentation. Tracers of the bioturbation are pronounced within the interval 250–300 cm. The sand fraction is almost absent, excluding the upper 30 cm and intervals 305–330 cm and 355–380 cm. The coarse fraction is mainly represented by radiolarians, sponge spicules, and agglutinated foraminifera. Poor preservation of calcareous foraminifera throughout the core section indicates pronounced carbonate dissolution. However, the rate of carbonate dissolution varies significantly.
The rare tests of planktonic foraminiferal species Globigerinoides ruber pink occur throughout the core section indicating the Mid-Pleistocene to Holocene age of the sediments [Barash, 1988]. In the core section, seven marine isotope stages (MIS) are identified. The concordance between distribution of CaCO$_3$ and standard stable isotope curve LR04 [Lisiecki and Raymo, 2005] indicates the climate-controlled sedimentation in the studied area (Figure 4).
Relatively high calcium carbonate content (up to 50%) is typical for warm MIS 1, 5 (a, c, e) and 7, with a maximum during the MIS 5e (56%). Minimal values of CaCO$_3$ (6–9%) correspond to glacials (MIS 2, 4, 6) and stadials of MIS 5 (b, d). Relatively cold MIS 3 is also marked by low CaCO$_3$ content (7–20%). Increased values of the TOC during the MIS 2, 3 and 6 correspond to the strengthening of the Canary upwelling during the cold intervals. However, MIS 4 doesn't show the high TOC content.
It should be noted that all warm periods are marked by relatively high CaCO$_3$ content despite the permanent presence of AABW in the study area. It allows us to suggest that aggressiveness of the AABW to CaCO$_3$ was changing during the investigated period. The previous studies [Diester-Haass, 1978; Dittert and Henrich, 2000] suggested the modern calcite lysocline depth to be 5000 m in the study area.
The investigation of the grain size distributions of the mineral part of ANS-33056 core sediments allows distinguishing the sedimentary patterns. The grain size distributions are bimodal. The 4-$\mu$m mode indicates the pelagic sedimentation [McCave and Hall, 2006]. The coarse silt mode at 14–17 $\mu$m is also clearly pronounced. It is well-known that this mode is sensitive to the variations in near-bottom current activity and is typical for contourites [McCave et al., 1995].
The significant distance of the studied area from the continental slope ($\sim 500$ km far away) and wide shelf (more than 250 km far away) almost completely isolates the investigated drift from the continent. Thus, the coarse-grained sediment supply from the land to the Kane Gap is prevented. Propagation of the turbidity currents from the continental shelf to the deep basins is quite active, especially during the glacial time when the sea level decreased. Here, sediment transport occurs along the giant canyons developed on the continental slope. The closest to the study area canyon is located on the Guinea Plateau slope (150 km north of the study area), at the downcurrent of AABW [Jones and Okada, 2006]. Moreover, studied drift is situated on the sub-bottom slope of the Sierra Leone Rise but not on the continental slope. Such position of the investigated drift, as well as the presence of the coarse silt mode, indicates the key role of the near-bottom current in sediment sorting in the study area. Thus, it is possible to use the $\overline{SS}$ parameter to evaluate the intensity of this current.
There is a weak positive trend in a current activity from MIS 7 to 1 (Figure 4). We did not find a
clear link between the near-bottom flow intensity and the glacial-interglacial alternations. However, there is a relationship with several short-time climatic fluctuations: strengthening of the near-bottom current during the cold MIS 4, 5b and 5d, as well as during the Terminations II and I (MIS 6/5 and MIS 2/1, respectively). Maximal current activity is registered at the end of the MIS 2. During MIS 1, the current activity was relatively high in comparison with previous warm periods. Thus, Mid-Quaternary to Holocene variations in the intensity of the AABW flow north of the Kane Gap indicate the nontrivial relationship between its activity and the global climatic cyclicity. This coincides with previous data on variations in the AABW flow at the exit of the Vema channel [Massé et al., 1994].
The values of integral speeds of the near-bottom geostrophic currents are obtained using the long-term hydrophysical measurements. Comparison of the quantitative grain size parameters with these values is a sophisticated process. However, according to McCave et al. [2017], it is possible to convert our $\overline{SS}$ data (15–21 $\mu$m, Figure 4) to the current speed values. Using such an approach we can suggest that during the investigated period the AABW flow speed varied in the 5–10 to 15–18 cm/s range. Herewith, it should be noted that in McCave et al. [2017] the data of Coulter Counter (Beckman Multisizer III) and Sedigraph 5100 were used when calculating the current speeds. Still there are no such calculations for the laser diffraction particle size analyzer. For this reason, our estimates of AABW flow speeds are very rough. It should be noted that these estimated values have been obtained at the downcurrent exit of the channel where current is slowing down and unloads. Directly in the Kane Gap, the flow was more intensive.
Two sources of AABW, circulating in the Kane Gap, are known [Hobart et al., 1975]: the southern one – from the Romanche fracture zone and Sierra Leone Basin, and the northern one – from the other fracture zones of the MAR and Gambia Basin. The modern studies have shown that AABW circulates along the Kane Gap both southwards and northwards. An alternation in AABW directions occurs several times per year. The northward transport of AABW prevails [Morozov et al., 2010, 2013]. Our data allow tracing the variations in the activity of the northward flow of AABW. It can be assumed that there is a similar contourite fan to the south of the Kane Gap. The sediments of this drift could provide information about southward AABW transport and its activity in the past.
The data on the seismoacoustic profiling confirm our suggestion about the contourite origin of the sediment drift north of the Kane Gap. The surface area of the drift is about 500 km$^2$ and maximal thickness is 70 m. The drift was formed by the contour current of the AABW. It has relatively steep slopes close to the axis of the AABW flow and flattens out with distance increasing from the flow axis. We suggest naming this contourite fan as the "the Kane Drift".
It was shown that within the MIS 1–7, the speed of the AABW flow north of the Kane Gap was not strictly determined by the glacial-interglacial alternation. Variations in the current activity within the marine isotope stages were also registered. Intensification of the near-bottom current coincides with MIS 4 and stadials of the MIS 5 demonstrating the strong relationship between the AABW flow and the climatic fluctuations. Moreover, during the Terminations II and I (MIS 2/1 and MIS 6/5, respectively), the intensity of the current was also increased. Maximal near-bottom current activity was registered at the end of the MIS 2. Despite the subsequent decrease, the near-bottom current activity during the MIS 1 was still relatively high, in comparison with previous maxima.
Barash, M. S. (1988), Quaternary paleoceanography of the Atlantic Ocean, 272 pp., Nauka, Moscow (in Russian).
Becker, J. J., et al. (2009), Global bathymetry and elevation data at 30 arc seconds resolution: SRTM30_PLUS, Marine Geodesy, 32, no. 4, p. 355–371, https://doi.org/10.1080/01490410903297766.
Diester-Haass, L. (1978), Influence of carbonate dissolution, climate, sea-level changes and volcanism on Neogene sediments off Northwest Africa (Leg 41), Init. Repts. DSDP, 41, p. 1033–1047.
Dittert, N., R. Henrich (2000), Carbonate dissolution in the South Atlantic Ocean: evidence from ultrastructure breakdown in Globigerina bulloides, Deep Sea Research Part I: Oceanographic Research Papers, 47, no. 4, p. 603–620, https://doi.org/10.1016/S0967-0637(99)00069-2.
Egloff, J. (1972), Morphology of ocean basin seaward of northwest Africa: Canary Islands to Monrovia, Liberia, AAPG Bulletin, 56, no. 4, p. 694–706.
Emelyanov, E. M., et al. (1990), Geology of the Sierra Leone Rise, Geologische Rundschau, 79, no. 3, p. 823–848, https://doi.org/10.1007/BF01879217.
Faugères, J. C., et al. (2002), The Vema contourite fan in the South Brazilian basin, Geological Society, London, Memoirs, 22, no. 1, p. 209–222.
Helmke, J. P., H. A. Bauch (2001), Glacial-interglacial relationship between carbonate components and sediment reflectance in the North Atlantic, Geo-Marine Letters, 21, no. 1, p. 16–22, https://doi.org/10.1007/s003670100067.
Hobart, M. A., E. T. Bunce, J. G. Sclater (1975), Bottom water flow through the Kane Gap, Sierra Leone Rise, Atlantic Ocean, Journal of Geophysical Research, 80, no. 1, p. 5083–5088, https://doi.org/10.1029/JC080i036p05083.
IOC, IHO, BODC, (2003), Centenary Edition of the GEBCO Digital Atlas, published on CD-ROM on behalf of the Intergovernmental Oceanographic Commission and the International Hydrographic Organization as part of the General Bathymetric Chart of the Oceans, British Oceanographic Data Centre, Liverpool, UK.
Johnson, D. A., K. A. Rasmussen (1984), Late Cenozoic turbidite and contourite deposition in the southern Brazil Basin, Marine Geology, 58, no. 1–2, p. 225–262, https://doi.org/10.1016/0025-3227(84)90125-7.
Jones, E. J. W., H. Okada (2006), Abyssal circulation change in the equatorial Atlantic: Evidence from Cenozoic sedimentary drifts off West Africa, Marine Geology, 232, no. 1–2, p. 49–61, https://doi.org/10.1016/j.margeo.2006.07.002.
Ledbetter, M. T. (1979), Fluctuations of Antarctic Bottom Water velocity in the Vema Channel during the last 160,000 years, Marine Geology, 33, no. 1–2, p. 71–89, https://doi.org/10.1016/0025-3227(79)90133-6.
Levchenko, O. V., I. O. Murdmaa (2013), Strategy of the lithological and seismoacoustic research of the deep-water deposits along transatlantic geotraverses during cruise 32 of the R/V Akademik Ioffe in the autumn of 2010 (Kaliningrad to Ushuaia), Oceanology, 53, no. 1, p. 124–128, https://doi.org/10.1134/S0001437013010098.
Lisiecki, L. E., M. E. Raymo (2005), A Pliocene–Pleistocene stack of 57 globally distributed benthic $\delta$18O records, Paleoceanography, 20, no. 1, p. PA1003 (1–17), https://doi.org/10.1029/2004PA001071.
Lund, D. C., J. F. Adkins, Ferrari (2011), Abyssal Atlantic circulation during the Last Glacial Maximum: Constraining the ratio between transport and vertical mixing, Paleoceanography, 26, no. 1, p. PA1213 (1–19), https://doi.org/10.1029/2010PA001938.
Massé, L., et al. (1994), A 600,000-year record of Antarctic Bottom Water activity inferred from sediment textures and structures in a sediment core from the Southern Brazil Basin, Paleoceanography, 9, no. 6, p. 1017–1026, https://doi.org/10.1029/94PA01442.
McCave, I. N., I. R. Hall (2006), Size sorting in marine muds: Processes, pitfalls, and prospects for paleoflow-speed proxies, Geochemistry, Geophysics, Geosystems, 7, no. 10, p. Q10NN05 (1–37), https://doi.org/10.1029/2006GC001284.
McCave, I. N., B. Manighetti, S. G. Robinson (1995), Sortable silt and fine sediment size/composition slicing: parameters for palaeocurrent speed and palaeoceanography, Paleoceanography, 10, no. 3, p. 593–610, https://doi.org/10.1029/94PA03039.
McCave, I. N., D. J. R. Thornalley, I. R. Hall (2017), Relation of sortable silt grain-size to deep-sea current speeds: Calibration of the "Mud Current Meter", Deep Sea Research Part I: Oceanographic Research Papers, 127, p. 1–12, https://doi.org/10.1016/j.dsr.2017.07.003.
Morozov, E. G., R. A. Tarakanov, A. N. Demidov (2010), Transport of bottom waters in the Kane Gap, Doklady Earth Sciences, 433, no. 2, p. 1062–1066, https://doi.org/10.1134/S1028334X10080155.
Morozov, E. G., R. Y. Tarakanov, H. van Haren (2013), Transport of Antarctic bottom water through the Kane Gap, tropical NE Atlantic Ocean, Ocean Science, 9, p. 825–835, https://doi.org/10.5194/os-9-825-2013.
Myhre, A. M., et al. (1995), Explanatory notes, Proceedings of the Ocean Drilling Program, Initial Reports, 15, p. 27–45.
Rebesco, M., et al. (2014), Contourites and associated sediments controlled by deep-water circulation processes: state-of-the-art and future considerations, Marine Geology, 352, p. 111–154, https://doi.org/10.1016/j.margeo.2014.03.011.
Seibold, E. (1982), Sediments in upwelling areas, particularly off Northwest Africa, Rapp. int. Cons. Explor. Sea, 180, p. 315–322.
Sivkov, V. V., et al. (2019), Complex studies during the 33rd cruise of the R/V Akademik Nikolaj Strakhov, Oceanology, 59, no. 2, p. 279–280 (in press).
Smith, W. H., D. T. Sandwell (1997), Global sea floor topography from satellite altimetry and ship depth soundings, Science, 277, no. 5334, p. 1956–1962, https://doi.org/10.1126/science.277.5334.1956.
Wentworth, C. K. (1922), A scale of grade and class terms for clastic sediments, The Journal of Geology, 30, no. 5, p. 77–392, https://doi.org/10.1086/622910.
Received 10 September 2018; accepted 25 October 2018; published 19 April 2019.

Citation: Sivkov V. V., L. D. Bashirova, E. V. Dorokhova, M. V. Kapustina, E. P. Ponomarenko (2019), Study of the Contourite Drift north of the Kane Gap (eastern equatorial Atlantic), Russ. J. Earth Sci., 19, ES2008, doi:10.2205/2019ES000658.
Copyright 2019 by the Geophysical Center RAS.