
RUSSIAN JOURNAL OF EARTH SCIENCES, VOL. 19, ES2005, doi:10.2205/2019ES000654, 2019
O. V. Kozyreva1, V. A. Pilipenko2,3, A. A. Soloviev1,2, M. J. Engebretson3
1Schmidt Institute of Physics of the Earth RAS, Moscow, Russia
2Geophysical Center RAS, Moscow, Russia
3Augsburg University, Minneapolis, MN, USA
Processes of the solar-wind/magnetosphere interaction can be monitored by magnetic records on the ground from the worldwide array of stations. However, a serious drawback of the analysis of ground-based magnetograms is the inevitable variation of the magnetic response due to continual changes of the station location. An ideal, but impossible, solution of this difficulty, that will help to discriminate temporal and spatial variations, would be the deployment of a "stationary" in situ observatory with a fixed position in the solar-magnetospheric coordinate system. However, the desired result can be obtained with the proposed technique of "virtual magnetograms" (VMs). This technique has been implemented for key magnetospheric domains (midnight auroral and noon cusp regions) as an additional tool for monitoring the response of the geomagnetic field to solar wind and interplanetary magnetic field forcing. A VM is reconstructed by 2D gridding and interpolation of 1-min magnetograms from $>200$ magnetic stations distributed worldwide. VMs have been produced for the period since 1994 up to the current year for both Northern and Southern hemispheres. A wide range of space physics studies, such as the solar wind-magnetosphere interaction, dayside-nightside coupling, etc. will benefit from the introduction of the VMs. The VMs for the dayside cusp and midnight auroral regions in both hemispheres, as well as simultaneous interplanetary parameters (solar wind density, electric field $E_y$) and geomagnetic indices ($AE$, SYMH, and PC), are combined in one plot. These quick-look plots and corresponding digital files are freely available via the web site http://vm.gcras.ru for all interested researchers for testing and validation. Here we present examples of VMs for the following phenomena: a sawtooth event, modulation of the dayside cusp by IMF variations, and coupling between the dayside cusp ULF activity and substorms. VM database may make the selection of events for subsequent in-depth analysis much easier.
The interaction between the solar wind with embedded interplanetary magnetic field (IMF) and the terrestrial magnetosphere is the main driver of many processes and phenomena occurring in the near-Earth environment. Magnetic disturbances on the ground, being the images of dynamic processes of solar-wind/magnetosphere interaction, can be monitored in the time domain by magnetic records. The number of permanently operating magnetic stations now exceeds 200 and continues to grow. A recent trend in the geomagnetism community implies the transition from studying data from a single magnetometer (L2-type data) to construction of models based on data from the global magnetometer array (L3-type products). Examples of such higher order products recently introduced in the geomagnetism are the new geomagnetic indices SMU/SML/SME of auroral electrojet strength (http://supermag.jhuapl.edu), the IMAGE electrojet indicators (http://space.fmi.fi/image/www), and ultra-low-frequency (ULF) wave power index (http://ulf.gcras.ru). Various techniques for constructing global maps of geomagnetic disturbances are being developed [Waters et al., 2015; Weimer et al., 2010].
However, a serious drawback of the analysis of ground-based magnetograms is the inevitable variation of the magnetic response due to continual changes of the station location in local time regarding the direction of the solar wind flow. An ideal, but impossible, solution of this difficulty would be the deployment of a "stationary" in-situ observatory with a fixed position in the solar-magnetospheric coordinate system. This will help to distinguish between temporal and spatial variations. However, the desired result can be obtained with the "virtual magnetometer" technique proposed here. A virtual magnetogram (VM) for a fixed reference system is reconstructed by interpolation of 1-min magnetograms from worldwide distributed magnetic stations. The availability of pre-calculated VMs for the ionospheric projections of key magnetospheric domains, such as the dayside cusp and midnight auroral oval, will facilitate enormously the quick-look analysis, event selection, and study of the ground response to various space weather events. Here we outline the production method of VMs, describe the structure of database with VMs for the period since 1994, and present several examples of VMs for different space weather events.
VM for ionospheric projections of key magnetospheric domains with fixed latitude/MLT geomagnetic coordinates is reconstructed from the data of the worldwide array of magnetic stations: INTERMAGNET, Greenland Coastal Chains, MAGDAS, MACCS, IMAGE, CARISMA/CANMOS, AARI network, and others in the Northern and Southern hemispheres. Most of these data are compiled in a unified 1-min database at the SuperMAG portal (http://supermag.jhuapl.edu).
VMs have been generated for the following fixed locations in the Northern and Southern hemispheres:
Data from the stations located within these latitudinal ranges only have been used for the VM construction. In the data from the SuperMAG database the baseline was subtracted using the algorithm described in [Gjerloev, 2012].
The raw data quality can be verified using the stacked magnetograms from all contributing stations. These plots have been included in the database.
The VM plots have been augmented with the basic interplanetary and geomagnetic parameters. Because of the limited format of the plots only the following information can be presented:
geomagnetic indices: SYMH index (http://swdcwww.kugi.kyoto-u.ac.jp/), characterizing magnetic storm intensity; PCN/PCS indices (http://pcindex.org), characterizing the energy supply into the high-latitude ionospheres; and the $AE$ index (http://wdc.kugi.kyoto-u.ac.jp/), characterizing the auroral activity.
A VM for a fixed reference system is constructed by 2D fitting and interpolation of 1-min magnetograms from the worldwide array of irregularly distributed magnetic stations. The "inverse distance" interpolation algorithm has been applied. From available world-wide stations, those are chosen that are within the pre-selected latitudinal range indicated in the section 2. Then, three nearest stations to a given MLT (00:00 or 12:00) are selected. If number of selected stations is less than 3, VM is not calculated. A current VM amplitude $A_0$ of each magnetic field components $\{X,Y,Z\}$ is calculated as follows
\begin{eqnarray*} A_0 = \frac{\sum_{i=1}^3 A_i d_i}{\sum_{i=1}^3 |d_i|} \end{eqnarray*} \begin{equation} \tag*{(1)} d_i^{-1} = \sqrt{(\mathrm{MLT}_i - \mathrm{MLT}_0)^2 + (\Phi_i - \Phi_0)^2} \end{equation}where $A_i=\{X,Y,Z\}$ is the amplitude at site ($i$), the "distance" $d_i$ is the weight coefficient depending on the MLT/latitude $(\Phi)$ difference between the VM location (index 0) and a selected station (index $i$). In (1) the latitude difference $\Delta \Phi$ is measured in degrees, while the longitudinal difference $\Delta $(MLT) is measured in hours. Thus, $\Delta \Phi =1\mbox{°}$ ($\sim 111$ km) provides the same contribution to the "inverse distance" as $\Delta $(MLT)$=1$ h (that is at auroral latitudes 15° $\sim 670$ km). This asymmetry takes into account a strong inhomogeneity of the geomagnetic disturbance field where a latitudinal gradient is much larger than a gradient in the longitudinal direction.
A VM plot combines both noon and midnight virtual magnetograms of geomagnetic response for the Northern and Southern hemispheres. Also, VM magnetograms are written in output multi-column ASCII files comprising $X,Y,Z$ components, interplanetary parameters, and geomagnetic indices. A freely-available database of VMs has been uploaded for validation and testing at the web site http://vm.gcras.ru/. Examples of VM plots will be presented below for several space weather events.
The VM technique was applied for the description of substorm activations during the "St. Patrick's day" geomagnetic storm on 17 March 2015 [Kozyreva et al., 2018a]. This peculiar magnetic storm was initiated by an interaction between high-speed solar wind streams in a corotating interaction region (CIR) and two coronal mass ejections (CMEs). During the very long ($\sim 17$ hours) main phase several isolated substorms took place. The VM provides more detailed fine structure of the substorm activity and more clearly indicates the onsets of each substorm than the $AE$ or PC indices do.
Here we demonstrate the possibility to apply the derived VMs to examine, on a case-by-case basis, such effects as:
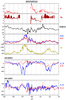
In addition to substorms, response modes of the magnetosphere include sawtooth events, which share common features with isolated substorms. A sawtooth event consists of a series of gradual decrease and rapid increases in energetic particle flux at geosynchronous orbit (i.e., particle injections), while an isolated substorm has one variation cycle. In fact, sawtooth oscillations are a sequence of storm-time substorms with an intrinsic occurrence periodicity of 2–3 hours, when nearly simultaneous energetic particle flux enhancements and magnetic field variations occur at all MLTs for each sawtooth cycle. It was suggested that the sawtooth oscillations are directly driven by a series of solar wind pressure $P$ enhancements, whereas even a modest dynamic pressure enhancement can result in significant changes in the magnetosphere when the IMF stays strongly southward for a long interval [Lee et al., 2004]. Alternatively, it was suggested that the sawtooth oscillations are a repetitive internal magnetospheric response to sustained solar wind energy input [Cai and Clauer, 2013; Fung et al., 2016].
The plot from the VM database for the event of 14 October 2000 (Figure 1) clearly reveals the quasi-periodic character of the nightside magnetosphere response during this sawtooth event (panel VM 00:00 MLT) during a weak magnetic storm ($|$SYMH$|$ up to 100 nT) driven by persistent (more than 17 hours) southward IMF $B_z$ (positive $E_y$). The VM time series indicates 8 substorms with magnetic bay amplitudes from $\sim 200$ nT to $\sim 700$ nT during 01:00–23:00 UT. Each substorm intensification is more evident in the VM, than in $AE$ or PC indices. Comparison of dynamic pressure $P$ and the midnight VM shows that sawtooth substorms during this event are triggered by the solar wind density enhancements (sometimes rather weak).
Extensive studies with global arrays of magnetometers involved showed that dayside ionospheric convection and current systems at high latitudes are driven by the IMF variations [Cai et al., 2009, 2006; Murr and Hughes, 2001; Milan et al., 2018]. This effect can be clearly seen with the VM technique, as was demonstrated in [Kozyreva et al., 2018b]. Comparison of IMF variations with VMs confirmed that the dayside ionospheric convection is indeed predominantly controlled by the IMF $B_z$.
A specific type of the space weather events is the high-speed solar wind streams (HSSs). A very important aspect of the HSSs is that they are embedded within large-amplitude Alfvén waves. These Alfvén waves propagating along the solar wind away from the Sun are believed to be remnants of heating processes in the solar atmosphere. The HSS-associated Alfvén waves, with intermittent negative IMF $B_z$ and large IMF $B_y$ component, may lead to significantly enhanced magnetospheric convection.
|
| Figure 2 |
Indeed, Echer et al. [2017] followed the coupling from the solar wind to the Earth's magnetotail, geosynchronous orbit, auroral zone and to the ground, during periods of Alfvénic fluctuations in HSS on September–October 2003, and found a range of periodic responses from 1.8 to 3.1 h. The VM for one of the period of HSS with solar wind Alfvénic waves on 17 September 2003 is shown in Figure 2. Each blip of positive $E_y$ (up to 6 mV/m) produces a corresponding negative geomagnetic disturbance (up to $\sim 1000$ nT) in the cusp region, as evident from VM for Northern hemisphere (panel VM 12:00 MLT). A significant magnetic response on the ground to IMF variations (about two orders of magnitudes amplification) may be due to convergence of near-magnetopause field lines into narrow cusp region [Pilipenko et al., 2000].
Very intense activity in the ULF range (from fractions of mHz to few Hz) is persistently observed at high latitudes during day time [Bolshakova et al., 1975, 1989; Troitskaya and Bolshakova, 1988]. Dynamic irregular long-period magnetic pulsations are observed almost every day over a wide period range (3–20 min) when a ground-based magnetic station happens to be within several hours from local noon. These high-latitude disturbances were denoted IPCL (Irregular Pulsations at Cusp Latitudes) or broad-band Pc5-6 pulsations. The issue of whether these pulsations are characteristic of some dayside boundary domain/boundary is still unresolved [e.g., Pilipenko et al., 2018], and the driver of these broadband dayside Pc5-6 pulsations has not been firmly established. They may be associated with pressure pulses [Kleimenova et al., 1999], plasma intrusions [Pilipenko et al., 2017], or intermittent bursts in the turbulent magnetosheath [Kurazkovskaya and Klain, 1990]. The high latitude broadband wave activity on the dayside cannot be simply associated with cusp proximity, but, instead, shows persistent activity across several hours of local time [Engebretson et al., 1995].
Much less is known about the relationships between nightside substorm activity and ULF disturbances in the dayside cusp region, and possible physical mechanisms for such coupling processes. Although there are some indications that such coupling between cusp-associated ULF activity and substorms may exist. Samson et al. [1992] suggested a wave channel for energy transmission across the magnetosphere which may provide an essential input to substorm energetics. It is feasible that ULF activity at high latitudes on the dayside is an indicator of an enhanced rate of turbulent energy supply into the magnetosphere during the growth phase of a substorm, and thus can be a substorm precursor.
Determination of the sequence of events leading to substorm onset is the long-standing problem. Dayside auroral and magnetic activity appearing shortly before substorm onset has gained attention because it may provide means to predict substorms for space weather forecasting purposes. However, controversy still exists regarding the existence of such coupling between dayside and nightside phenomena. Auroral observations by Elphinstone et al. [2013] suggested that dayside events are affected by the same solar wind disturbances, which later affect nightside magnetospheric dynamics. Lyons et al. [2011] proposed that enhanced mesoscale flows from well within the region of open polar cap field lines may cross the nightside polar cap boundary and contribute to the triggering of poleward boundary intensifications (PBIs) and auroral streamers, eventually leading to substorm onset. Other researchers concluded that substorms are not likely to be triggered by a solar wind disturbance, which propagates in a visible manner from dayside to nightside. Sandholt et al. [1985] presented examples showing the disconnection of dayside auroral arcs from the nightside aurora.
Nonetheless, observational evidences of dayside-nightside coupling are mounting, though most of them remain not well understood and validated. According to Eather et al. [1979] all substorms result in equatorward shifts of the dayside aurora. Statistics of the IPCL bursts shows that $>80$% of bursts in the dayside cusp [Kurazkovskaya and Klain, 2009] occur at the background of developing substorm in the nightside auroral oval. Just before break-up Vorobiev et al. [1992] observed a decrease of the intensity of dayside aurora with duration 3–8 min, most evident in the "green" (557.7 nm) line, whereas the "red" (630.0 nm) line intensity remained practically unchanged. ULF pulsation precursors of substorms in the polar cap were found using data from Vostok station in Antarctica: long-period pulsation amplitudes became higher at last pre-substorm hours in comparison with non-substorm days [Yagova et al., 2000]. Rostoker et al. [1984] noticed that statistically southward turning IMF $B_z$ nearly 2 hours before onset is accompanied by an apparent peak in daytime Pc5 power. Yagodkina and Vorobiev [2000] found that the expansive phase of a nightside auroral substorm was accompanied by a short-lived ($\sim 10$ min) enhancement in the daytime pulsation power in 3–8 s (Pc1-2) and 30–80 s (Pc3-4) period ranges.
Here we present examples of other effects of the dayside-nightside coupling during substorms, not thoroughly examined yet.
4.3.1. Dayside ULF precursor of substorm and suppression of cusp-related ULF activity by onset. An effect evidencing the coupling between the dayside ULF activity and substorm is suppression of cusp-related ULF activity by substorm onset [Kleimenova et al., 1998; Pilipenko et al., 1998]. A relevant effect was observed with SuperDARN radars that detected a mesoscale convection vortex in the afternoon sector, which abruptly disappeared with the onset of a midnight substorm [Greenwald et al., 1996]. The authors attributed the vortex disappearance to a redirection of magnetospheric closure currents as consequence of a significant increase in the nightside conductivity during a substorm expansion. Bolshakova et al. [1997] interpreted the occurrence of daytime IPCL pulsations and their disappearance during nighttime substorm as the manifestation of ULF precursor of a substorm. Indeed, an enhanced reconnection at the dayside magnetopause provides energy for an impending substorm, and this turbulent process may reveal itself in an enhancement of cusp-related ULF disturbances.
 |
| Figure 3 |
The effect of dayside IPCL suppression during nightside substorm on 7 March 2015 (10:00–19:00 UT) can be seen in VM (Figure 3). The substorm with maximum $AE>1200$ nT and PC $\sim 4$ mV/m develops during 16:00–17:00 UT. Since 10:00 UT persistent monochromatic Pc5 pulsations are observed at dayside in both Northern and Southern hemispheres. The gradual substorm onset which started around 16:00 UT results in the suppression of dayside Pc5 pulsations. Formally, this event may be interpreted as an occurrence of the cusp ULF precursor of nighttime substorm.
 |
| Figure 4 |
To illustrate the content of the VM database, for this event we present an example of stacked magnetograms from stations used for the construction of the cusp VM (Figure 4). This plot enables one to check the data quality, and to examine a contribution of particular stations into a combined VM.
4.3.2. Triggering of dayside ULF waves by nightside substorm.
Rostoker et al. [1984] found that total power in the Pc5 band at auroral latitudes close to dawn (06:00–09:00 LT) appears to be elevated during a large substorm expansive phase. They proposed that these pulsations are caused by a Kelvin-Helmholtz (KH) instability in the interface between the sunward convecting plasmasheet plasma and the anti-sunward flowing low-latitude boundary layer (LLBL) plasma. According to their model the northward turning of IMF $B_z$ triggers a substorm expansive phase and thinning of LLBL. The latter reduces the width of the shear zone and leads to stimulation of the KH instability.
 |
| Figure 5 |
4.3.2. Triggering of dayside ULF waves by nightside substorm. Figure 5 shows dayside cusp-related ULF activity during various phases of nightside substorm on 22 March 2015. Southward oriented IMF $B_z$ (and correspondingly positive $E_y$) causes two adjacent substorm expansions (with peak of $AE \sim 1400$ nT) at $\sim $06:30–07:40 UT. At the substorm recovery phase intense IPCL pulsations emerge in the Northern cusp region for nearly 6 hours, from $\sim 08$:00 until $\sim 14$:00 UT. At the same time, in the Southern cusp region monochromatic Pc5 waves are stimulated.
4.3.3. Change of dayside pulsation dominant frequency during nighttime substorm onset.
Samson and Rostoker [1981] found that large amplitude dayside Pc5 pulsations seemed to disappear with the onset of a substorm expansive phase and were replaced by higher frequency pulsations in the Pc3-4 range. They proposed that sudden inward ring current motion causes changes in the magnetic field in the equatorial plane of the magnetosphere and, respectively, in the Alfvén period.
 |
| Figure 6 |
4.3.3. Change of dayside pulsation dominant frequency during nighttime substorm onset. An example of the Samson-Rostoker event is shown in Figure 6. For $\sim 3$ hours before a moderate substorm ($AE \sim 400$ nT) at $\sim $10:30 UT on 13 December 2015, IPCL pulsations with predominant period $\sim 10-15$ min are observed. After substorm, since $\sim 11$:00 UT, monochromatic Pc5 waves with periods $\sim 3-4$ min last for about 4 hours.
Substorms can be divided into "polar" and ordinary "high latitude" substorms [Despirak et al., 2014]. During "polar" substorms all disturbances are concentrated in a narrow latitude region near the polar cap ($\Phi >70$°), and usually occur, when the auroral oval is contracted and poleward shifted. During "high latitude" substorms, a disturbance starts at auroral latitudes, then propagates poleward, whereas the westward electrojet moves to high geomagnetic latitudes ($>75$°) [Despirak et al., 2008; Mende et al., 1999]. It is not yet clear whether mechanisms of high-latitude and polar substorms are the same.
 |
| Figure 7 |
An example of a polar substorm is the event on 31 October 2007 (Figure 7). A weak southward IMF $B_z<0$ (positive $E_y$) after 09:00 UT causes geomagnetic activity activation as evident from the elevated level of $AE$ index from 10:00 UT until 16:00 UT. No clear signatures of an isolated substorm are evident in the $AE$- or PC-index behavior. At the same time, VM evidently reveals a weak substorm onset (magnetic bay $>150$ nT) at $\sim $13:50 UT. This weak substorm develops on the background of elevated IPCL/Pc5 activity. Such kind of weak substorm accompanied by intense dayside ULF activity may be a result of "thermal catastrophe" substorm, stimulated by the wave heating of the plasmasheet plasma [Goertz and Smith, 1989].
We have developed a provisional database (of L3-type) of "virtual" 1-min magnetograms for two fixed locations: noon and midnight meridian at typical cusp and auroral latitudes, using the data from worldwide magnetometers. The noon and midnight VMs from both Northern and Southern hemispheres are combined in one plot, together with the solar wind and IMF data and geomagnetic indices.
Several examples presented here are intended to demonstrate that the usage of pre-calculated VMs significantly facilitates quick-look selection and analysis of space weather events. An analysis of one combined VM is far easier than the standard analysis of numerous magnetograms from a global array of stations with unavoidable time-space ambiguity. This technique might be useful to reveal a ground response to IMF/SW discontinuities, dayside-nightside coupling, triggering and precursors of substorms, sawtooth events, etc. Moreover, VM data provides a possibility to easily estimate the time response between IMF variations and dayside ionospheric convection, without space-time ambiguity.
To illustrate usefulness of the VM technique, we have presented some interesting events with a probable substorm/cusp coupling. These events demonstrate that a substorm is not a localized nightside phenomenon, but a global process influencing the entire magnetosphere. A substorm onset was found to impact the ULF wave generation process at dayside high latitudes, causing either suppression or stimulation of ULF activity. However, the number of events is too small so far to discuss the reliability of the effects listed above. Here we deliberately do not discuss any physical conclusions, because our main goal is to present a new tool for event selection and analysis, and to discuss its possible applications for the geophysical community.
The VM database for the period since 1994 up to nowadays is available for validation and testing at the web site http://vm.gcras.ru. The IDL program for plotting VM for any desired time interval from VM database is enclosed, too. Any suggestions or corrections are appreciated and will be taken into account in further updates.
The technique of VM construction can be updated and modified. Sometimes jumps are observed, which may be caused by several reasons: interference in raw data from a contributing station or lack of stations in some regions. The rarity of stations in some low-populated regions with harsh weather conditions (e.g., Russian Arctic, Antarctica) and oceans is the main issue in any attempt to construct a global characteristic of geomagnetic field variations. We are permanently working on upgrade of the magnetometer database and adding new data whenever they become available. So far, VM for the Southern hemisphere is less reliable because of a much worse station coverage. In further studies, we plan to test other algorithms of gridding and interpolation, e.g., polynomial regression. In further versions we plan to use the SuperMAG SME index instead of $AE$.
Bol'shakova, O. V., V. A. Troitskaya, W. P. Hessler (1975), Location of the near-pole boundary of the dayside cusp from the intensity of high-latitude pulsations, Geomagn. Aeron., 15, p. 755–757.
Bolshakova, O. V., et al. (1989), Long period pulsations (VLP) and night-side magnetospheric disturbances during substorm, Geomagn. Aeron., 29, p. 161–164.
Bolshakova, O. V., et al. (1997), A substorm precursor in geomagnetic pulsations of dayside cusp, Geomagn. Aeron., 37, p. 148.
Cai, H. T., I. W. McCrea, M. W. Dunlop, J. A. Davies, Y. V. Bogdanova, F. Pitout, S. E. Milan, M. Lockwood, S. Y. Ma (2009), Cusp observations during a sequence of fast IMF $B_z$ reversals, Ann. Geophys., 27, p. 2721–2737, https://doi.org/10.5194/angeo-27-2721-2009.
Cai, X., C. R. Clauer, A. J. Ridley (2006), Statistical analysis of ionospheric potential patterns for isolated substorms and sawtooth events, Ann. Geophys., 24, p. 1977–1991, https://doi.org/10.5194/angeo-24-1977-2006.
Cai, X., C. R. Clauer (2013), Magnetospheric sawtooth events during the solar cycle 23, J. Geophys. Res., 118, p. 6378–6388, https://doi.org/10.1002/2013JA018819.
Despirak, I. V., A. A. Lyubchich, Kh. K. Birnat, A. G. Yakhnin (2008), Poleward expansion of the westward electrojet depending on the solar wind and IMF parameters, Geomagn. Aeron., 48, p. 284–292, https://doi.org/10.1134/S001679320803002X.
Despirak, I. V., A. A. Lyubchich, N. G. Kleimenova (2014), Polar and high latitude substorms and solar wind conditions, Geomagn. Aeron., 54, p. 575, https://doi.org/10.1134/S0016793214050041.
Eather, R. H., S. B. Mende, E. J. Weber (1979), Dayside aurora and relevance to substorm current systems and dayside merging, J. Geophys. Res., 84, p. 3339, https://doi.org/10.1029/JA084iA07p03339.
Echer, E., A. Korth, M.J.A. Bolzan, R.H.W. Friedel (2017), Global geomagnetic responses to the IMF $B_z$ fluctuations during the September/October 2003 high-speed stream intervals, Ann. Geophys., 35, p. 853–868, https://doi.org/10.5194/angeo-35-853-2017.
Elphinstone, R. D., J. S. Murphree, L. L. Cogger, D. Hearn, M. G. Henderson, R. Lundin (2013), Observations of Changes to the Auroral Distribution Prior to Substorm Onset, Magnetospheric Substorms, J. R. Kan, T. A. Potemra, S. Kokubun and T. Iijima (eds.), https://doi.org/10.1029/GM064p0257.
Engebretson, M. J., W. J. Hughes, J. L. Alford, E. Zesta, L. J. Cahill, R. L. Arnoldy, G. D. Reeves (1995), Magnetometer array for cusp and cleft studies observations of the spatial extent of broadband ULF magnetic pulsations at cusp/cleft latitudes, J. Geophys. Res., 100, p. 19,371–19,386, https://doi.org/10.1029/95JA00768.
Fung, S. F., J. A. Tepper, X. Cai (2016), Magnetospheric state of sawtooth events, J. Geophys. Res., 121, p. 7860–7869, https://doi.org/10.1002/ 2016JA022693.
Gjerloev, J. W. (2012), The SuperMAG data processing technique, J. Geophys. Res., 117, https://doi.org/10.1029/2012JA017683.
Goertz, C. K., R. A. Smith (1989), The thermal catastrophe model of substorms, J. Geophys. Res., 94, p. 6581, https://doi.org/10.1029/JA094iA06p06581.
Greenwald, R. A., J. M. Ruohoniemi, W. A. Bristow, G. J. Sofko, J.-P. Villain, A. Huuskonen, S. Kokubun, L. A. Frank (1996), Mesoscale dayside convection vortices and their relation to substorm phase, J. Geophys. Res., 101, p. 21,697, https://doi.org/10.1029/96JA01639.
Kleimenova, N., O. Kozyreva, M. Bitterli, J. Bitterli (1998), Relation of sudden transformations of IPCL geomagnetic pulsations in cusp to the substorm beginning on the nightside, Geomagn. Aeron., 38, p. 58–65.
Kleimenova, N. G., P. Francia, U. Villante, O. V. Kozyreva, J. Bitterly, J.-J. Schott (1999), The temporal and spatial variations of low frequency geomagnetic pulsations at polar cusp and cap latitudes, Annali di Geofisica, 42, p. 675–682.
Kozyreva, O. V., V. A. Pilipenko, V. B. Belakhovsky, Ya. A. Sakharov (2018a), Ground geomagnetic field and GIC response to March 17, 2015 storm, Earth Planets and Space, 70, p. 157, https://doi.org/10.1186/s40623-018-0933-2.
Kozyreva, O. V., V. A. Pilipenko, A. A. Soloviev (2018b), Virtual magnetograms – new tool for the study of geomagnetic response to the solar wind/IMF driving, Physics of Auroral Phenomena, Proc. XLI Annual Seminar, p. 22–25, Polar Geophysical Institute, Apatity.
Kurazkovskaya, N. A., B. I. Klain (1990), Peculiar features of burst series of long-period irregular IPCL-type geomagnetic pulsations in the vicinity of the dayside cusp, Geomagn. Aeron. Int., 2, p. 129–135.
Kurazkovskaya, N. A., B. I. Klain (2009), Burst regimes of long-period irregular pulsations in the band 2.0–6.0 mHz and substorm activity at nightside of the magnetosphere, Geomagn. Aeron., 49, p. 483–493.
Lee, D.-Y., L. R. Lyons, K. Yumoto (2004), Sawtooth oscillations directly driven by solar wind dynamic pressure enhancements, J. Geophys. Res., 109, p. A04202, https://doi.org/10.1029/2003JA010246.
Lyons, L. R., Y. Nishimura, H.-J. Kim, E. Donovan, V. Angelopoulos, G. Sofko, M. Nicolls, et al. (2011), Possible connection of polar cap flows to pre- and post-substorm onset PBIs and streamers, J. Geophys. Res., 116, p. A12225, https://doi.org/10.1029/2011JA016850.
Mende, S. B., H. U. Frey, S. P. Geller, J. H. Doolittle (1999), Multistation observations of auroras: Polar cap substorms, J. Geophys. Res., 104, p. 2333–2342, https://doi.org/10.1029/1998JA900084.
Milan, S. E., J. A. Carter, H. Sangha, K. M. Laundal, N. \Ostgaard, P. Tenfjord, et al. (2018), Timescales of dayside and nightside field-aligned current response to changes in solar wind-magnetosphere coupling, J. Geophys. Res., 123, https://doi.org/10.1029/2018JA025645.
Murr, D. L., W. J. Hughes (2001), Reconfiguration timescales of ionospheric convection, Geophys. Res. Lett., 28, p. 2145–2148, https://doi.org/10.1029/2000GL012765.
Pilipenko, V., O. Kozyreva, M. Engebretson, W. J. Hughes, S. Solovyev, K. Yumoto (1998), Coupling between substorms and ULF disturbances in the dayside cusp, Proceedings of the International Conference on Substorms-4, p. 573–576, Kluwer Academic Publishers, Boston, https://doi.org/10.1007/978-94-011-4798-9_119.
Pilipenko, V. A., E. N. Fedorov, M. J. Engebretson, V. O. Papitashvili, J. Watermann (2000), Poleward progressing quasi-periodic disturbances at cusp latitudes: The role of wave processes, J. Geophys. Res., 105, no. NA12, p. 27,569–27,588, https://doi.org/10.1029/2000JA900076.
Pilipenko, V. A., O. V. Kozyreva, M. J. Engebretson, A. A. Soloviev (2017), ULF wave power index for the space weather and geophysical applications: A review, Russ. J. Earth. Sci., 17, no. 2, p. ES1004, https://doi.org/10.2205/2017ES000597.
Pilipenko, V. A., O. V. Kozyreva, D. A. Lorentzen, L. J. Baddeley (2018), The correspondence between dayside long-period geomagnetic pulsations and the open-closed field line boundary, J. Atmospheric Solar-Terrestrial Physics, 170, p. 64–74, https://doi.org/10.1016/j.jastp.2018.02.012.
Rostoker, G., I. Spadinger, J. Samson (1984), Local time variations in the response of Pc 5 pulsations in the morning sector to substorm expansive phase onsets near midnight, J. Geophys. Res., 89, p. 6749, https://doi.org/10.1029/JA089iA08p06749.
Samson, J. C., G. Rostoker (1981), Response of dayside Pc 5 pulsations to substorm activity in the nighttime magnetosphere, J. Geophys. Res., 86, p. 733, https://doi.org/10.1029/JA086iA02p00733.
Samson, J. C., D. D. Wallis, T. J. Hughes, F. Cretzberg, J. M. Ruohoniemi, R. A. Greenwald (1992), Substorm intensifications and field line resonances in the nightside magnetosphere, J. Geophys. Res., 97, p. 8495, https://doi.org/10.1029/91JA03156.
Sandholt, E., A. Egeland, J. A. Holtet, B. Lybekk, K. Svenes, S. Asheim (1985), Large- and small-scale dynamics of the polar cusp, J. Geophys. Res., 90, p. 4407, https://doi.org/10.1029/JA090iA05p04407.
Troitskaya, V. A., O. V. Bolshakova (1988), Diagnostics of the magnetosphere using multipoint measurements of ULF waves, Adv. Space Res., 8, no. 9–10, p. 413–425, https://doi.org/10.1016/0273-1177(88)90155-X.
Vorob'ev, V. G., V. L. Zverev, G. V. Starkov (1992), Fading of dayside aurora before the growth phase of substorm, Geomagn. Aeron., 32, p. 71.
Waters, C. L., J. W. Gjerloev, M. Dupont, R. J. Barnes (2015), Global maps of ground magnetometer data, J. Geophys. Res. Space Physics, 120, p. 9651–9660, https://doi.org/10.1002/2015JA021596.
Weimer, D. R., C. R. Clauer, M. J. Engebretson, T. L. Hansen, H. Gleisner, I. Mann, K. Yumoto (2010), Statistical maps of geomagnetic perturbations as a function of the interplanetary magnetic field, J. Geophys. Res., 115, p. A10320, https://doi.org/10.1029/2010JA015540.
Yagodkina, O. I., V. G. Vorobjev (2000), Enhancement of power of dayside geomagnetic pulsations during magnetospheric substorm onset, Geomagn. Aeron., 40, p. 49–55.
Yagova, N., V. Pilipenko, A. Rodger, V. Papitashvili, J. Watermann (2000), Long period ULF activity at the polar cap preceding substorm, Proc. 5th International Conference on Substorms, p. 603–606, ESA SP-443, St. Peterburg, Russia.
Received 2 December 2018; accepted 26 February 2019; published 28 March 2019.

Citation: Kozyreva O. V., V. A. Pilipenko, A. A. Soloviev, M. J. Engebretson (2019), Virtual magnetograms -- a tool for the study of geomagnetic response to the solar wind/IMF driving, Russ. J. Earth Sci., 19, ES2005, doi:10.2205/2019ES000654.
Copyright 2019 by the Geophysical Center RAS.