RUSSIAN JOURNAL OF EARTH SCIENCES, VOL. 18, ES6007, doi:10.2205/2018ES000640, 2018
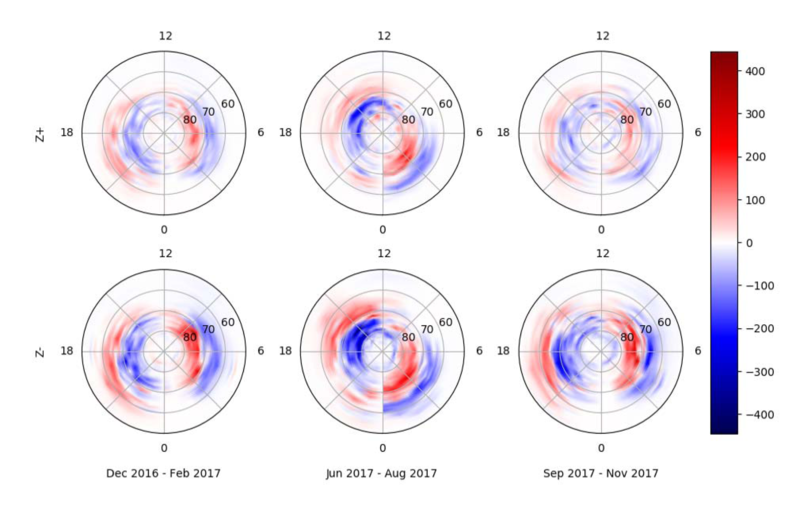
Figure 4. Distributions of FAC densities (in 10${}^{-9}$ A/m${}^{2}$) inferred from the Swarm A data for northern winter (left), northern summer (middle), and northern fall equinox (right) polar caps in the MLT-MLat coordinates; red regions are downward currents, and blue regions are upward currents, while white areas generally denote a lack of available data. The upper and lower plots correspond to the IMF $B_z>0$ and $B_z<0$, respectively.

![]()
Citation: Lukianova R. Yu., Sh. R. Bogoutdinov (2018), Statistical maps of field-aligned currents inferred from Swarm: dependence on season and interplanetary magnetic field, Russ. J. Earth Sci., 18, ES6007, doi:10.2205/2018ES000640.
Copyright 2018 by the Geophysical Center RAS.
Generated from LaTeX source by ELXpaper, v.1.5 software package.