RUSSIAN JOURNAL OF EARTH SCIENCES, VOL. 18, ES5002, doi:10.2205/2018ES000629, 2018
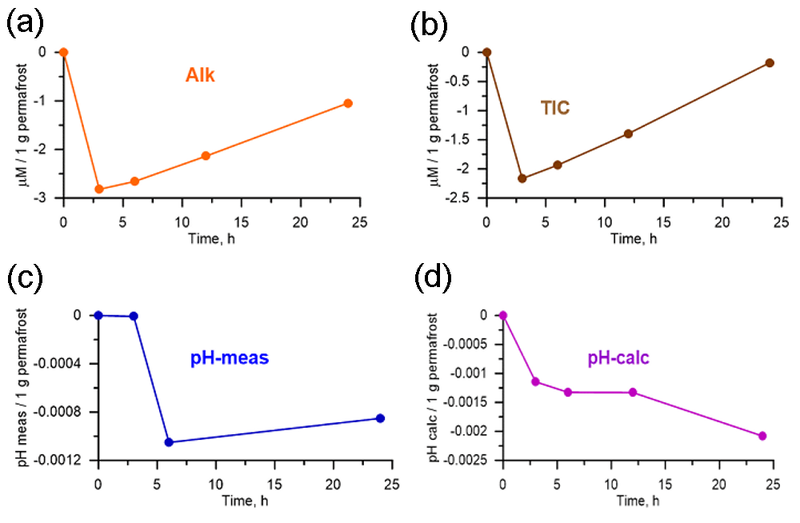
Figure 3. Change of concentrations of Alkalinity (a), Total Inorganic Carbon, TIC (b), pH measured (c) and pH calculated (d) due to thawing of 1 g of permafrost in 1 liter of the sea water.

![]()
Citation: Pogojeva M., E. Yakushev, A. Ilinskaya, A. Polukhin, H.-F. Braaten, T. Kristiansen (2018), Experimental study of the influence of thawing permafrost on the chemical properties of sea water, Russ. J. Earth Sci., 18, ES5002, doi:10.2205/2018ES000629.
Copyright 2018 by the Geophysical Center RAS.
Generated from LaTeX source by ELXpaper, v.1.5 software package.