RUSSIAN JOURNAL OF EARTH SCIENCES, VOL. 18, ES5001, doi:10.2205/2018ES000628, 2018
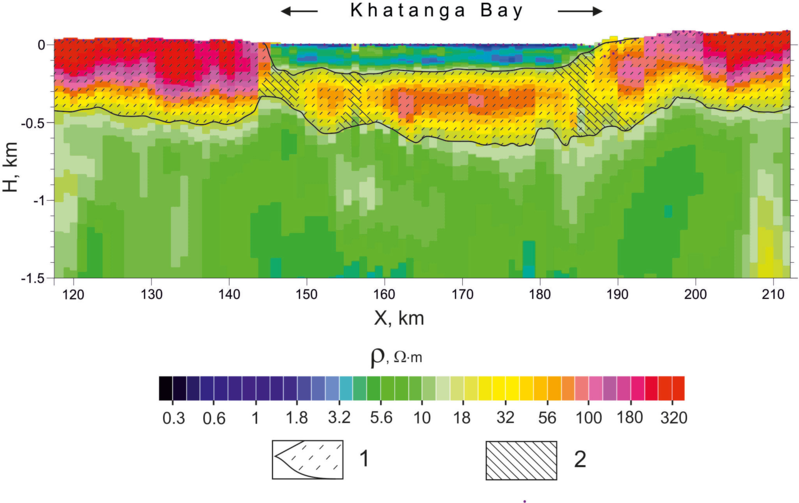
Figure 7. Resistivity image across the Khatanga Bay. $X$ is the distance along profile, $H$ is depth. Electrical resistivity values are shown as a color plot, with the color scale shown in the bottom of the figure. Explanation: 1 – ice-bonded permafrost, 2 – taliks.

![]()
Citation: Piskunova E. A., N. A. Palshin, D. V. Yakovlev (2018), Electrical conductivity features of the Arctic shelf permafrost and electromagnetic technologies for their studies, Russ. J. Earth Sci., 18, ES5001, doi:10.2205/2018ES000628.
Copyright 2018 by the Geophysical Center RAS.
Generated from LaTeX source by ELXpaper, v.1.5 software package.