RUSSIAN JOURNAL OF EARTH SCIENCES, VOL. 18, ES1004, doi:10.2205/2018ES000616, 2018
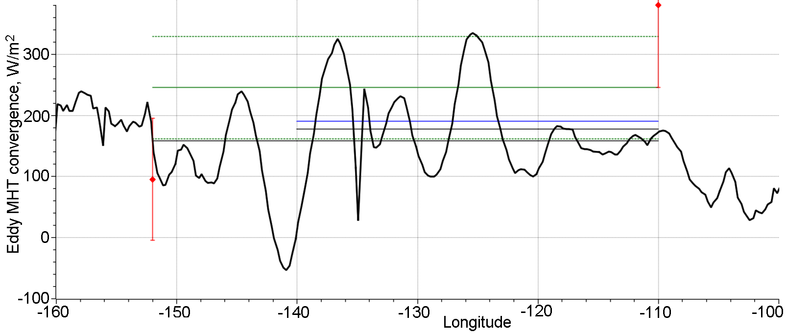
Figure 5. Meridional distribution of the EMHT convergence at the equator (W/m$^2$). The black thick curve presents the INMIO model data. The solid blue and green lines are zonal mean values from [Jayne and Marotzke, 2002] and [Bryden and Brady, 1989], thin black lines denote the zonal mean INMIO values in respective longitude ranges. Dashed green lines show the error estimate of the zonal mean value in [Bryden and Brady, 1989]. Red diamonds with error bars are data from [Bryden and Brady, 1989] at 110° W and 152° W.

![]()
Citation: Ushakov K. V., R. A. Ibrayev (2018), Assessment of mean world ocean meridional heat transport characteristics by a high-resolution model, Russ. J. Earth Sci., 18, ES1004, doi:10.2205/2018ES000616.
Copyright 2018 by the Geophysical Center RAS.
Generated from LaTeX source by ELXpaper, v.1.5 software package.