RUSSIAN JOURNAL OF EARTH SCIENCES, VOL. 18, ES2002, doi:10.2205/2017ES000610, 2018
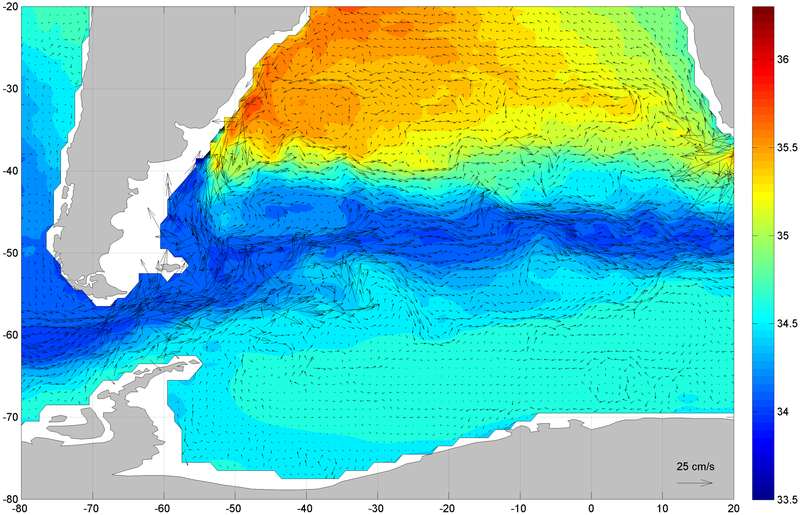
Figure 2. Maps of the annual mean velocities and salinity in the Atlantic sector of the Southern Ocean at 250 m. Velocity scale is shown with an arrow. Salinity color scale is shown on the right.

![]()
Citation: Lebedev K. V., R. Yu. Tarakanov (2018), A model study of the wind stress influence on the interannual variability of the Antarctic Circumpolar Current, Russ. J. Earth Sci., 18, ES2002, doi:10.2205/2017ES000610.
Copyright 2018 by the Geophysical Center RAS.
Generated from LaTeX source by ELXpaper, v.1.5 software package.