RUSSIAN JOURNAL OF EARTH SCIENCES, VOL. 17, ES5003, doi:10.2205/2017ES000612, 2017
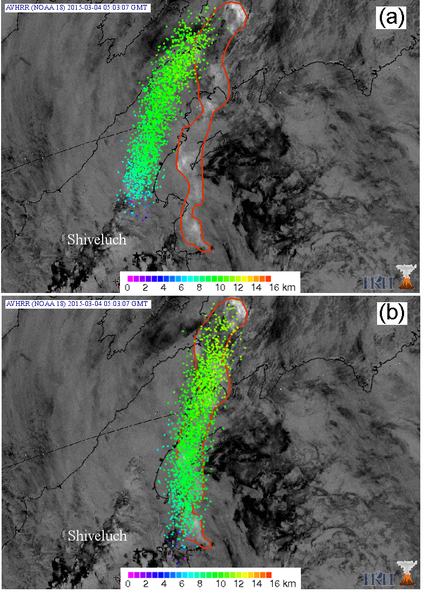
Figure 4. A comparison of the numerical simulation results on dynamics of the ash cloud movement obtained using the original (a) and modified (b) puff utility versions (color scale showing a height range of ash particle occurrence) and the satellite data.

![]()
Citation: Malkovsky Sergey I., Aleksei A. Sorokin, Sergey P. Korolev (2017), Improving the system of numerical simulation of volcanic ash propagation using the PUFF model, Russ. J. Earth Sci., 17, ES5003, doi:10.2205/2017ES000612.
Copyright 2017 by the Geophysical Center RAS.
Generated from LaTeX source by ELXpaper, v.1.5 software package.