
RUSSIAN JOURNAL OF EARTH SCIENCES, VOL. 17, ES4003, doi:10.2205/2017ES000606, 2017
V. A. Martines-Bedenko1, V. A. Pilipenko2, M. J. Engebretson3, M. B. Moldwin4
1Institute of the Physics of the Earth RAS, Moscow, Russia
2Geophysical Center RAS, Moscow, Russia
3Augsburg University, Minneapolis, MN, USA
4University of Michigan, Ann Arbor, MI, USA
We have examined snapshots of overlaid ultra-violet (UV) auroral images from POLAR and IMAGE spacecraft and ULF wave power in the Pi2 frequency band (5–30 mHz). The latitudinal distribution of the Pi2 spectral power, as well as the position of the ionospheric electrojet, are inferred from the MACCS-CARISMA-MEASURE array of magnetic stations. A substorm develops as a series of "detonations", accompanied by an enhancement of auroral luminosity, intensification of the ionospheric currents, and a burst of Pi2 wave power. The epicenter of each detonation leaps during each activation poleward and westward. The latitudinal location of the auroral ionospheric westward electrojet and Pi2 power is found to be mainly associated with the poleward border of the auroral activation region. The result of case studies is supported by statistical superposed latitudinal distributions of the auroral intensity and Pi2 power. The found correspondence between the UV auroral oval and Pi2 power "epicenter" may help to identify a possible channel of Pi2 wave energy transmission from the magnetotail to the ground.
Though Pi2 pulsations with periods 40–150 sec belong to one of the most well-known types of ultra-low-frequency (ULF) waves, there is still no confirmative physical interpretation of their generation mechanism. In a review [Keiling and Takahashi, 2011] seven alternative mechanisms of Pi2 generation were discussed. To some extent, this situation is quite natural because it is unrealistic to create the final theory of Pi2 before the construction of a general theory of a substorm. Nowadays the latter problem is a still incomplete task of geophysics. Nonetheless, in a similar way as seismic waves provide information about an earthquake focus, Pi2 may be used as a clue to understanding the nature of a substorm and magnetotail dynamics [Rae and Watt, 2016]. The solution of this problem to a great extent depends on the ability to resolve the spatial-temporal sequence of key substorm-related processes in the tail, magnetosphere, and ionosphere with the highest possible accuracy [Kepko et al., 2003; Yamaguchi et al., 2002].
Despite the short duration of Pi2 event ($< 10$ min), its wave structure at auroral latitudes is rather complicated, because several wave modes may be involved [Fujita et al., 2000; Yumoto et al., 1990].
A classical Pi2 waveform – damping short train, prompts the rather trivial idea that Pi2 wave activity is the transient response to some rapid large-scale change of the nightside magnetospheric current system, comprising the magnetospheric field-aligned current (FAC) and the ionospheric auroral electrojet (AEJ) [Olson, 1999]. The rapid reconfiguration of the global current system in the nightside magnetosphere occurs during the cross-tail current disruption, which is believed to result in the excitation of transient Alfven field line eigenoscillations at auroral latitudes [Baumjohann and Glassmeier, 1984]. The resultant Pi2 pulsations are superposed on an onset-associated magnetic bay. In general, any rapid (as compared to time scale of Pi2) change of electrodynamic properties of the magnetosphere-ionosphere system must excite a transient oscillatory response. Therefore, Pi2 transients seemingly should accompany such steep variations as a precipitation- induced change of the ionospheric conductance [Mal'tsev et al., 1974], and occurrence of field-aligned anomalous resistance [Pilipenko et al., 2005]. Pi2-related Alfven waves can actively participate in the transition of the substorm-related instability into an explosive phase with positive magnetosphere-ionosphere feedback [Lysak and Song, 2002].
Although, there are suggestions that Pi2 is not just a decaying transient, but is a result of a fast developing oscillatory instability. The observational support was found for the scenario when exponentially growing Pi2 disturbance is excited in the near-Earth plasma sheet by a local ballooning instability prior to the onset of auroral arc expansion and magnetotail field dipolarization [Chang and Cheng, 2015; Keiling, 2012]. This local instability can further trigger a reconnection of the magnetotail magnetic field with a much larger energy release.
Most clear Pi2 signatures are observed not in the auroral region, but at middle latitudes, down to the dip equator. This global quasi-monochromatic response is supposedly produced by large-scale fast compressional mode waves, resonantly exciting cavity oscillations of the plasmasphere [Sutcliffe and Yumoto, 1991].
An initial trigger of Pi2 response may be related to some fast process ("tailquake") during the substorm onset, such as reconnection, fast plasma flows, dipolarization front, etc. A substorm development is often observed as a sequence of localized activations in the night magnetosphere. Each substorm activation, probably, is the result of some instability of a locally unsteady magnetospheric configuration. Experimental determination of the Pi2 correspondence to substorm origin region is not a trivial thing, because a Pi2 train propagates from a source in a combined wave mode, whereas several paths of the wave energy transfer may operate and "illuminates" the entire nightside magnetosphere. There are several possible scenarios of ULF signal penetration from the tail into the nightside polar ionosphere. The first mechanism interprets a possible coupling of ULF waves in the tail with magnetic disturbances on the ground by invoking the conversion of impulsively generated compressional modes at the plasmasheet/lobe interface into Alfven waves propagating along the stretched field lines towards the night side ionosphere [Allan and Wright, 1998; Liu et al., 1995]. According to this scenario a ground ULF response to disturbances in the distant tail should be observed near the poleward auroral oval boundary, assuming that the auroral oval is the image of the plasmasheet plasma. Another scenario is related to direct excitation of Alfven waves by a "tailquake" near the current sheet, and their field-aligned propagation towards the ionosphere [Ma et al., 1995; Semenov et al., 1999]. Finally, the plasmasheet with increased plasma density and current sheet form MHD waveguides [Edwin et al., 1986]. Such a waveguide is able to accumulate and guide the energy of MHD perturbations towards the Earth. Disturbances in the tail, first, propagate along the plasmasheet or current sheet towards their inner boundary, and, second, are converted in this region into Alfven waves, transporting field-aligned currents (FACs) towards the ionosphere [Mazur et al., 2010]. The tail-related signals of this type are to be observed primarily near the equatorward auroral oval boundary.
For identification of mechanisms of substorm onset and Pi2 burst it is important to know their association with the basic magnetospheric domains, such as the open/closed field line boundary (OCB) or auroral oval. On the nightside the poleward edge of auroral oval can be used as an OCB proxy [Lorentzen et al., 2004]. A location of the auroral oval can be determined from energetic particle measurements by the polar-orbiting Defense Meteorological Satellite Program (DMSP) satellites. DMSP data are not affected by sunlight, and sensitivity of the particle data is many times greater than is possible from auroral imagers. However, particle detectors can sample only a tiny portion of the aurora at one instant. The OCB can be detected optically from satellite observations of the poleward boundary of the ultra-violet (UV) auroral oval [Longden et al., 2010], though such observations are not regularly available.
In this paper we examine the spatial correspondence between the locations of Pi2 wave power and the global auroral pattern observed using a satellite UV image. This may help to identify the location of a source of Pi2 pulsations and identify the path of wave energy transmission towards the ionosphere.
We use optical data from POLAR and IMAGE spacecraft. The POLAR Ultraviolet Imager (UVI) takes images of the entire auroral oval in the molecular nitrogen N2 band centered at Lyman-Birge-Hopfield filters 170 nm (LBHL) and 150 nm (LBHS) with an integration time of 37 s. These data do not allow to examine precisely a timing between auroral activations and geomagnetic disturbances. The auroral luminosity observed with the long (L) filter is proportional to total energy flux (insensitive to particle energy), while the short (S) line is more sensitive to soft precipitation. The effective pixel resolution of the instrument from apogee is $\sim 100$ km.
We have converted the UVI images into geomagnetic latitude–local time ($\Phi$–MLT) coordinates, applied a line-of-sight (LOS) correction, and removed dayglow from the images. From available data for 1996–2001, however, we found that only data for 1996–1999 are reliable. In 2000–2001, the apogee of POLAR's orbit drifted equatorward of the auroral zone, and therefore the spacecraft imaged the northern polar region from a low inclination; thus, its LOS correction and dayglow removal might become erratic and unreliable. Therefore, for the period 2000–2001 we use the Wideband Imaging Camera (WIC) from three sub-instruments for the far UV registration onboard IMAGE satellite. From the POLAR/IMAGE UV data we construct a sequence of digital images with superposed magnetic stations. The time evolution of auroral intensity is characterized by a time series of integrated UV intensity in a specified filter in the chosen $\Delta$MLT and $\Delta\Phi$ sector. The accuracy of imaging technique for the determination of auroral boundaries may cast doubt because of poor sensitivity of auroral imagers, in particular distinguishing between the diffuse and discrete auroral ovals using UV images is difficult. Nonetheless, comparison of auroral boundaries from Polar UVI images with boundaries derived from DMSP electron precipitation data showed that though their differences are near 0, though offsets up to 4o may appear [Carbary et al., 2003].
A statistical location of the auroral oval for given solar wind and IMF parameters can be estimated with the OVATION-prime model (sd-www.jhuapl.edu/Aurora/ovation_prime/index.html). This model is based on energetic particle measurements from the DMSP satellites and considers main types of auroras: discrete electron monoenergetic aurora and broadband diffuse aurora [Newell et al., 2009]. Diffuse aurora is primarily caused by the precipitation of energetic electrons (0.1–30 keV) over a broad latitude range. Although generally not visible to the naked eye, the diffuse auroral precipitation provides the main energy source for the high-latitude upper atmosphere. The discrete aurora at higher latitudes is dominated by soft electron precipitation (0.1–1 keV). The poleward boundary used in the OVATION model is intended to be the OCB.
|
| Figure 1 |
 |
| Table 1 |
We use magnetic data composed from the high-latitude MACCS array [Engebretson et al., 1995] and CARISMA auroral array [Mann et al., 2008] of flux-gate magnetometers in Arctic Canada with sampling period 5 sec. All available stations are organized into the latitudinal geomagnetic profile along the 330° geomagnetic meridian: TAL–BLC–RAN–EKP–FCC–GIM–ISL–PIN. At lower latitudes, these arrays are augmented with available stations from the MEASURE magnetometers. Locations of all used stations are shown in Figure 1, and the station coordinates are given in Table 1.
The position of the auroral electrojet is determined as the latitude where the vertical $Z$-component of magnetic disturbance reverses sign, whereas the North-South $H$-component is maximal. The reference value of the magnetic field for the determination of magnetic disturbance is taken as the value prior to the substorm onset.
The latitudinal profile of 3-component magnetic field disturbance has been compared with the latitudinal distribution of the UV intensity, and Pi2 power taken during the time interval around each auroral snap shot (with parameters averaged over a $\pm 2.5$ min window, centered on the time moment indicated). The intensity of the Pi2 signal has been estimated as the integrated spectral power $S$ ($Bxy$) of both horizontal components in the frequency band 5–30 mHz. The data have been preliminarily high-pass filtered with a cut-off period of 300 s. The relative Pi2 spectral power is indicated on UV snap-shorts at each station location as a color coded circle.
To present adequately the dynamics of ionospheric electrodynamics and aurora is a hard problem, because during a substorm onset they all not only grow fast, but also move in space. Here we present different aspects of their evolution for two typical events.
 |
| Figure 2 |
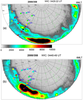
2000, 12/23 event (day 358). Between 0430 and 0530 UT on Dec. 23, 2000 several auroral activations occurred as can be seen from IMAGE auroral WIC images. The first one was recorded at 0429:22 UT eastward from the 330° profile (Figure 2a). After that, the auroral blob expanded longitudinally toward the $330\mbox{°}$ profile and then faded away. At 0437:33 UT the second auroral intensification was recorded. At 0449:49 UT the auroral intensification region reached the $330\mbox{°}$ profile (Figure 2b). The set of these snap-shots indicates a general tendency of a westward and poleward leap of each subsequent activation as compared with the previous one. We do not consider other subsequent intensifications during this substorm.
 |
| Figure 3 |
Each noticeable auroral activation occurs simultaneously with the onset of a magnetic bay, which is evident from comparison of $X$-component magnetograms from a latitudinal profile of magnetic stations and time variations of the spatially integrated UV intensity (Figure 3). Each auroral activation is accompanied by a magnetic bay, progressively shifted during the first intensification from ISL to GIM, and during the second intensification from GIM to RAB–FSM (Figure 3a). The onset of each magnetic bay and auroral intensification is marked by the occurrence of a Pi2 train (Figure 3a). During the first activation on $\sim$0430 UT the Pi2 signature is most evident at middle latitude, e.g. at MSH, JAX, (Figure 3b, bottom panel). At high latitudes (Figure 3b, upper panel), one can see not an isolated Pi2 wave train, but rather the onset of irregular pulsation activity in the Pi2 frequency band. During the second activation on $\sim 0450$ UT irregular fluctuations in the Pi2 band intensifies at high latitudes with maximal intensity at GIM, but just a weak response is observed at middle/low latitudes. Later Pi2 bursts, e.g. at $\sim 0500$ UT, are not considered.
 |
| Figure 4 |
Dynamic spectra of geomagnetic variations in the Pi2 band (frequencies from 0.5 mHz to 150 mHz) along the $330\mbox{°}$ latitudinal profile are shown in Figure 4. This figure illustrates that Pi2 power bursts during each auroral activation, but the wave power "epicenter" shifts progressively poleward. No systematic change of frequency of subsequent Pi2 bursts at different latitudes can be seen as the substorm evolves.
The color coding of each station location on maps in Figure 2 corresponds to the relative intensity of Pi2 power around activation onset. These maps roughly show that maximum Pi2 power is observed near the poleward boundary of the auroral oval, near its westward edge (GIM, FCC).
 |
| Figure 5 |
This result has been additionally validated by the construction of a 1D latitudinal distribution of the electron precipitation zone derived from the OVATION model, the UV intensity, the magnetic field disturbance, and the Pi2 power taken during a short time interval around the auroral activation (Figure 5). The position of the auroral electrojet is determined as the latitude where $X$ component has a maximum, while $Z$ component changes sign. The $D$-component disturbance is weak for all the events under consideration, which justifies the assumption about a longitudinally extended auroral electrojet.
The local auroral activation, as observed by WIC around 0430 UT, occurs at $\sim 62$°, that is around the equatorward edge of the statistical auroral oval constructed from the OVATION model (Figure 5a). These 1D profiles confirms that the latitudinal maximum of Pi2 power meridian is around 67° (GIM), near the poleward boundary of the auroral activation. The westward AEJ develops in a region with maximum around GIM station. The AEJ tends to be also shifted poleward from the auroral spot. It is worth to mention that during this activation the magnetometer profile and UV profile were separated (cf. Figure 2a), so the results of the comparison should be considered with some care.
Comparison of Figure 5a with a similar plot for the second activation around 0450 UT (Figure 5b), shows that the "gravity center" of auroral intensity leaps northward from one activation to another. The auroral electrojet leaps together with the spot during each activation, from $\sim 66-67\mbox{°}$ at 0430 UT to $\sim 70\mbox{°}$ (around FCC) at 0450 UT. The location of Pi2 power maximum demonstrates the same tendency (Figure 4): a poleward shift from GIM to FCC during subsequent activations.
 |
| Figure 6 |
2001 02/01 event (day 032). From 0400 UT to 0530 UT on Feb. 01, 2001 several auroral activations occurred. The first one at $\sim $0423:52 UT took place near the $330\mbox{°}$ meridian (Figure 6a). The maximal Pi2 activity was observed near the poleward boundary of the auroral oval (RAB), closer to its westward edge. Then, the auroral activity faded away and its remnants went west.
The auroral oval activated again at $\sim$0442:17 UT, and extended till the $300\mbox{°}$ meridian (Figure 6b). The maximal Pi2 power, as characterized by the color-coded station circles, was observed near the poleward boundary of auroral brightness (EKP). Later on, the bright auroral spot moved west, whereas the greatest Pi2 power occurred near its westward edge. Later auroral activations occurred far from the $300\mbox{°}$ and $300\mbox{°}$ meridians and are not shown.
 |
| Figure 7 |
Each auroral activation is accompanied by magnetic bays in $H$-component, progressively shifted from (GIM) to (EKP, RAN) (Figure 7a). The onset of each magnetic bay is marked by the occurrence of a Pi2 train. During the first activation on $\sim 0425$ UT the isolated Pi2 signal is most evident at mid-latitude stations MSH, APL, and DSO (Figure 7b). At high latitudes, during this activation one can see not an isolated Pi2 wave train, but rather the onset of irregular pulsation activity in the Pi2 frequency band. During the second activation, on $\sim$0440 UT, a burst of irregular pulsations in the Pi2 band is observed at high latitudes (with maximal power at GIM), but no response can be seen at middle/low latitudes.
 |
| Figure 8 |
Dynamic spectra of geomagnetic variations in the Pi2 band along the 330° latitudinal profile are shown in Figure 8. This plot demonstrates that bursts of high-latitude Pi2 are shifted subsequently upon each activation to higher latitudes from GIM-ISL to EKP. The frequency of subsequent Pi2 bursts at different latitudes does not change.
 |
| Figure 9 |
Figure 9 shows the latitudinal profiles of OVATION-derived precipitation, intensities of the UV auroral emission, magnetic disturbance produced by the auroral electrojet, and Pi2 power along the 330° meridian. The auroral activation originates in the equatorward part of the statistical auroral oval, in the region of diffuse precipitation. Around the time 0425 UT (Figure 9a) the auroral electrojet develops in the vicinity of GIM. The maximum of Pi2 power is around this station, too. Epicenters of both auroral electrojet and Pi2 power are at the poleward edge of the auroral luminosity profile. The next activation at $\sim$0444 UT originates and develops at higher latitudes than the first one (Figure 9b). The auroral electrojet intensifies around EKP-RAN. In the Pi2 power distribution an additional peak emerges around EKP, too.
 |
| Figure 10 |
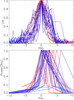
To verify the conclusions made upon the analysis of case studies, we have constructed statistical distributions of the UV intensity and Pi2 power. This statistical analysis is based on 31 selected Pi2 events: 22 events in 1996, 5 in 2000, and 4 in 2001. These events have been selected from both POLAR UVI (shown in blue color) and IMAGE WIC (red color). All the latitudinal distributions of UV intensity during time intervals when Pi2 had been detected are summed up (Figure 10, upper panel). The distributions have been normalized to the maximal value, and the latitude of the maximum is allocated to the reference 0° latitude. The corresponding normalized latitudinal distributions of Pi2 power have been shifted in latitude accordingly for each event (Figure 10, bottom panel). The comparison of these distributions shows that Pi2 power is predominantly located either under the maximum of the auroral emission, or is displaced to the poleward boundary of the auroral oval. This result confirms statistically the conclusions made from case studies.
During some events (e.g., 2001/032, 0445 UT) a double peak in latitudinal distribution of Pi2 power occurs. The weaker peak corresponds to the maximum of UV intensity, while the larger peak corresponds to the poleward edge of the auroral oval.
Despite the well-known general association of Pi2 activity with substorm onset and auroral intensification [e.g., Takahashi et al., 2002], specific mechanisms of the formation of Pi2 structure and wave propagation paths from the magnetotail towards the high-latitude ionosphere have not been firmly revealed. Numerous theories of Pi2 generation seem to give a quite probable interpretation of some aspects of Pi2 phenomenon, but the attempts to unite the existing theoretical models of Pi2 with other typical elements of a substorm demonstrate the obvious insufficiency of the theoretical conceptions [Keiling and Takahashi, 2011].
Even some primary questions still have not got any definite answer, e.g. what factor determines the periodicity of Pi2 response to the substorm onset? The frequency content of Pi2 is to be governed either by natural resonant properties of the nightside magnetosphere, or by the frequency content of a Pi2 driver, or in fact by combination of both. It was often suggested that the dominant Pi2 periodicity at high latitudes is determined by Alfvenic wave bounce time between conjugated ionospheres in a region of the onset. However, characteristic Pi2 periods, $\sim$1–2 min, are noticeably less than the fundamental eigenperiod of Alfven field line oscillations at auroral latitudes, $\sim$5–10 min. Moreover, if Pi2 were just a transient eigenoscillation of a local field line where an auroral activation has occurred, then the Pi2 period should increase gradually upon subsequent leaps to higher latitudes. However, we have noticed no consistent variations of spectral content between subsequent wave bursts in a Pi2 series.
There are several hypothetical possibilities to handle this issue. Any plasma disturbance (e.g., particle injection) near the magnetospheric equatorial plane must excite preferably symmetric Alfven harmonics with a maximal field line displacement at the top of a field line [Hameiri and Kivelson, 1991]. The fundamental Alfven mode between low-conductive ionospheres has an asymmetric field-aligned structure with a node of plasma velocity at the equator, so only second harmonic with nearly two times higher frequency can be excited. Finally, Wolfe et al. [2012] suggested that a periodic response to the onset may be the result of oscillations of a hot plasma filament near its equilibrium state. Probably, this mechanism cannot resolve the Pi2 periodicity issue because the filament oscillation period is always larger than the Alfvenic bounce period.
Thus, high-latitude Pi2 signals are probably mainly forced oscillations, whose frequency content is determined by a source spectrum. A promising hypothesis is that high-speed Earthward bursty bulk flows (BBF) in the central plasma sheet with velocities around hundred-thousand km/s in localized channels $\sim$2–3 RE wide could be a driver of forced Pi2 excitation. These flows often exhibit a temporal fine structure comprising $\sim$1 min flow bursts encapsulated into BBF with duration 10 min. Enhanced buffeting of the nightside magnetosphere by BBF with such internal periodicity during the substorm activations would induce a quasi-periodic response. This hypothesis still remains questionable, although a correspondence between ground Pi2 signals and BBF in the magnetotail has been reported [Hsu and McPherron, 2007; Kepko and Kivelson, 1999; Shiokawa et al., 1998; Xing et al., 2015]. About 80% of mid-latitude Pi2 were found to be caused by BBF [Wang et al., 2015]. BBF are associated with poleward auroral boundary intensifications [Lyons et al., 1999], and thus some Pi2 signals may be related to the poleward boundary intensifications during both substorm and non-substorm periods [Kim et al., 2005]. At the same time, Murphy et al. [2011] showed that BBF was not directly-driving the ground Pi2, despite the fact that a visual inspection of both time-series might initially suggest that there is a causal relationship. No spectral correspondence between ground Pi2 and BBF have been found by Nose [2010]. The statistical study of BBF oscillatory flows and ground response showed that the frequency of ground geomagnetic response is on average twice the frequency of the plasmasheet flows [Panov et al., 2014].
 |
| Figure 11 |
 |
| Figure 12 |
The occurrence of several channels coupling the magnetotail dynamics and terrestrial ionosphere was evidenced from many studies. Uozumi et al. [2000] found that for many Pi2 events the magnetic energy observed at the high-latitude station KTN mapped onto the equatorial plane at a distance $\sim$30 RE from the Earth, and appeared somewhat earlier ($\sim$20 sec) than at the auroral station CHD (mapped to $\sim$5.5 RE), although amplitudes of Pi2 at KTN were mostly smaller than those at CHD. The UVI POLAR images showed that it was when the auroral oval was located equatorward to KTN that the Pi2 amplitude tended to reach maximum earlier in the polar cap/auroral oval boundary rather than in the auroral region. The model of wave conversion at the plasmasheet-lobe interface [e.g., Allan and Wright, 1998] fits these observations.
In the events analyzed the Pi2 signals are not coherent at high and middle latitudes, moreover there is no one-to-one correspondence between the high-latitude and low-latitude Pi2s. In the auroral region a Pi2 signature in fact marks the onset of irregular pulsations in the Pi2 band, whereas at middle latitudes a clear isolated wave packet can be seen. Probably, physical mechanisms of Pi2 waves at different latitudes are different, too. The wave response at middle latitudes is associated with the excitation of a global plasmasphere cavity mode, whereas high- latitude Pi2 is probably the result of an incidence onto the ionosphere of localized Alfvenic disturbances that originated in the magnetotail region.
ULF wave bursts in the nightside magnetosphere can be not just a marker of dynamic phenomena, but play an active role in the aurora activations ("Alfvenic aurora"). Alfvenic waves with proper transverse scales can contribute to the energy flux into the auroral oval [Pilipenko et al., 2004]. There is much observational evidence that ULF electromagnetic disturbances can provide sufficient Poynting flux to power the acceleration of auroral electrons [Keiling et al., 2003; Wygant et al., 2000]. The strongly enhanced downward Poynting flux associated with these perturbation fields occurred when the spacecraft was at the poleward auroral boundary during a substorm magnetically conjugate to intense auroral structures detected by the POLAR imager. Whether Pi2 waves do contribute to aurora intensification is not known.
The superposition of sequences of UV auroral images from POLAR or IMAGE, the ionospheric electrojet and wave power in the Pi2 frequency band derived from latitudinal magnetometer profile has confirmed that a substorm develops as a series of "detonations", accompanied by an enhancement of auroral luminosity, intensification of the ionospheric currents, and burst of Pi2 wave power [Shiokawa et al., 2002]. The epicenter of each "detonation" leaps during each activation poleward and westward. Though epicenter of the Pi2 power is observed roughly in the same region where the auroral electrojet will develop, Pi2 signals cannot be imagined as transient eigenoscillations of auroral field lines. Probably, physical mechanisms of Pi2 response to substorm onset are different at auroral and middle latitudes: The wave response at middle latitudes is associated with the excitation of a plasmasphere cavity mode, whereas high-latitude Pi2 is the result of the incidence onto the ionosphere of Alfvenic disturbances that originated in the magnetotail region. The meridional location of the Pi2 power tends to be associated to the poleward border of the auroral activation region. These observational result fits the model of ULF wave transmission from the magnetotail to the ionosphere either along the plasmasheet-lobe interface or inside the plasmasheet. It seems promising that ground ULF observations along a latitudinal magnetometer network may be used to identify an instant location of the magnetospheric domain boundaries.
Allan, W., A. N. Wright (1998), Hydromagnetic wave propagation and coupling in a magnetotail waveguide, J. Geophys. Res., 103, p. 2359.
Baumjohann, W., K. H. Glassmeier (1984), The transient response mechanism and Pi2 pulsations at substorm onset – Review and outlook, Planet. Space Sci., 32, p. 1361–1370.
Carbary, J. F., T. Sotirelis, P. T. Newell, C.-I. Meng (2003), Auroral boundary correlations between UVI and DMSP, J. Geophys. Res., 108, p. 1018, doi:10.1029/2002JA009378.
Chang, T. F., C.-Z. Cheng (2015), Relationship between wave-like auroral arcs and Pi2 disturbances in plasma sheet prior to substorm onset, Earth, Planets and Space, 67, p. 168, doi:10.1186/s40623-015-0334-8.
Edwin, P. M., B. Roberts, W. J. Hughes (1986), Dispersive ducting of MHD waves in the plasma sheet: A source of Pi2 wave bursts, Geophys. Res. Lett., 13, p. 370–373.
Engebretson, M. J., et al. (1995), Magnetometer array for cusp and cleft studies observations of the spatial extent of broadband ULF magnetic pulsations at cusp/cleft latitudes, J. Geophys. Res., 100, p. 19,371–19,386.
Fujita, S., M. Itonaga, H. Nakata (2000), Relationship between the Pi2 pulsations and the localized impulsive current associated with the current disruption in the magnetosphere, Earth Planets Space, 52, p. 267–281.
Hameiri, E., M. G. Kivelson (1991), Magnetospheric waves and the atmosphere-ionosphere layer, J. Geophys. Res., 96, p. 21,125–21,134.
Hsu, T.-S., R. L. McPherron (2007), A statistical study of the relation of Pi2 and plasma flows in the tail, J. Geophys. Res., 112, p. A05209, doi:10.1029/2006JA011782.
Keiling, A., et al. (2003), The global morphology of wave poynting flux: Powering the aurora, Science, 299, p. 383–386.
Keiling, A., K. Takahashi (2011), Review of Pi2 models, Space Sci. Rev., 161, p. 63–148.
Keiling, A. (2012), Pi2 pulsations driven by ballooning instability, J. Geophys. Res., 117, p. A03228, doi:10.1029/2011JA017223.
Kepko, L., M. G. Kivelson (1999), Generation of Pi2 pulsations by bursty bulk flows, J. Geophys. Res., 104, p. 25,021–25,034.
Kepko, L., M. G. Kivelson, R. L. McPherron, H. E. Spence (2003), Relative timing of substorm onset phenomena, J. Geophys. Res., 109, p. A04203, doi:10.1029/2003JA010285.
Kim, K.-H., et al. (2005), Pi2 pulsations associated with poleward boundary intensifications during the absence of substorms, J. Geophys. Res., 110, p. A01217, doi:10.1029/2004JA010780.
Liu, W. W., B. L. Xu, J. C. Samson, G. Rostoker (1995), Theory and observation of auroral substorms: A MHD approach, J. Geophys. Res., 100, p. 79–95.
Longden, N., et al. (2010), Estimating the location of the open-closed magnetic field line boundary from auroral images, Ann. Geophys., 28, p. 1659–1678.
Lorentzen, D. A., N. Shumilov, J. Moen (2004), Drifting airglow patches in relation to tail reconnection, Geophys. Res. Lett., 31, p. L02806, doi:10.1029/2003GL017785.
Lyons, R. L., et al. (1999), Association between Geotail plasma flows and auroral poleward boundary intensifications observed by CANOPUS photometers, J. Geophys. Res., 104, p. 4485–4500.
Lyons, R. L., I. O. Voronkov, E. F. Donovan, E. Zesta (2002), Relation of substorm breakup arc to other growth-phase auroral arcs, J. Geophys. Res., 107, p. 1390, doi:10.1029/2002JA009317.
Lysak, R. L., Y. Song (2002), Energetics of the ionospheric feedback interaction, J. Geophys. Res., 107, p. SIA 6-1–SIA 6-13, doi:10.1029/2001JA000308.
Ma, Z. W., L. C. Lee, A. Otto (1995), Generation of field-aligned currents and Alfven waves by 3D magnetic reconnection, Geophys. Res. Lett., 22, p. 1737–1740.
Mal'tsev, Yu. P., S. V. Leont'ev, V. B. Lyatsky (1974), Pi2 pulsations as a result of evolution of an Alfven impulse originating in the ionosphere during a brightening of aurora, Planet. Space Sci., 22, p. 1519.
Mann, I. R., et al. (2008), The upgraded CARISMA magnetometer array in the THEMIS era, Space Sci. Rev., 141, p. 413–451.
Mazur, N. G., E. Fedorov, V. Pilipenko (2010), MHD waveguides in space plasma, Plasma Physics Report, 36, p. 653–670.
Murphy, K. R., et al. (2011), The dependence of Pi2 waveforms on periodic velocity enhancements within bursty bulk flows, Ann. Geophys., 29, p. 493–509, doi:10.5194/angeo-29-493-2011.
Newell, P. T., T. Sotirelis, S. Wing (2009), Diffuse, monoenergetic, and broadband aurora: The global precipitation budget, J. Geophys. Res., 114, p. A09207, doi:10.1029/2009JA014326.
Nose, M. (2010), Excitation mechanism of low-latitude Pi2 pulsations: Cavity mode resonance or BBF-driven process?, J. Geophys. Res., 115, p. A07221, doi:10.1029/2009JA015205.
Olson, J. V. (1999), Pi2 pulsations and substorm onsets: A review, J. Geophys. Res., 104, p. 17,499–17,520.
Panov, E. V., et al. (2014), Period and damping factor of Pi2 pulsations during oscillatory flow braking in the magnetotail, J. Geophys. Res., 119, p. 4512–4520.
Pilipenko, V., E. Fedorov, M. J. Engebretson, K. Yumoto (2004), Energy budget of Alfven wave interactions with the auroral acceleration region, J. Geophys. Res., 109, p. A10204, doi:10.1029/2004JA010440.
Pilipenko, V., N. Mazur, E. Fedorov, T. Uozumi, K. Yumoto (2005), Excitation of Alfven impulse by the anomalous resistance onset on the auroral field lines, Ann. Geophys., 23, p. 1455–1465.
Rae, I. J., C. E. J. Watt (2016), ULF waves above the nightside auroral oval during substorm onset, "Low frequency waves in space plasmas", Keiling A., Lee D. H., Nakariakov V. (eds), p. 99–120, Wiley, US, doi:10.1002/9781119055006.
Semenov, V., Y. Bogdanova, R. Rijnbeek, M. . Buchan (1999), A new mechanism for interpreting the motion of auroral arcs in the nightside ionosphere, Geophys. Res. Lett., 26, p. 2367–2370, doi:10.1029/1999GL900526.
Shiokawa, K., K. Yumoto, J. V. Olson (2002), Multiple auroral brightenings and associated Pi2 pulsations, Geophys. Res. Lett., 29, p. 32-1–32-4, doi:10.1029/2001GL014583.
Shiokawa, K., et al. (1998), High-speed ion flow, substorm current wedge, and multiple Pi2 pulsations, J. Geophys. Res., 103, p. 4491–4508.
Sutcliffe, P. R., K. Yumoto (1991), On the cavity mode nature of low-latitude Pi2 pulsations, J. Geophys. Res., 96, p. 1543–1551.
Takahashi, K., K. Liou, K. Yumoto (2002), Correlative study of ultraviolet aurora and low-latitude Pi2 pulsations, J. Geophys. Res., 107, p. 1417, doi:10.1029/2002JA009455.
Uozumi, T., et al. (2000), Characteristics of energy transfer of Pi2 magnetic pulsations: Latitudinal dependence, Geophys. Res. Lett., 27, p. 1619–1622.
Wang, G. Q., et al. (2015), A statistical analysis of Pi2-band waves in the plasma sheet and their relation to magnetospheric drivers, J. Geophys. Res., 120, p. 6167–6175.
Wolf, R. A., C. X. Chen, F. R. Toffoletto (2012), Thin filament simulations for Earth's plasma sheet: Interchange oscillations, J. Geophys. Res., 117, p. A02215, doi:10.1029/2011JA016971.
Wygant, J. R., et al. (2000), Polar spacecraft based comparisons of intense electric fields and Poynting flux near and within the plasma sheet-tail lobe boundary to UVI images: An energy source for the aurora, J. Geophys. Res., 105, p. 18,675–18,692.
Xing, X., C.-P. Wang, J. Liang, L. R. Lyons (2015), Plasma sheet Pi2 pulsations associated with bursty bulk flows, J. Geophys. Res., 120, p. 8692–8706.
Yamaguchi, R., et al. (2002), The timing relationship between bursty bulk flows and Pi2s at the geosynchronous orbit, Geophys. Res. Lett., 29, p. 1–4, doi:10.1029/2001GL013783.
Yumoto, K., et al. (1990), Multiple ground-based and satellite observations of global Pi2 magnetic pulsations, J. Geophys. Res., 95, p. 15,175–15,184.
Received 16 November 2017; accepted 16 November 2017; published 4 December 2017.

Citation: Martines-Bedenko V. A., V. A. Pilipenko, M. J. Engebretson, M. B. Moldwin (2017), Time-spatial correspondence between Pi2 wave power and ultra-violet aurora bursts, Russ. J. Earth Sci., 17, ES4003, doi:10.2205/2017ES000606.
Copyright 2017 by the Geophysical Center RAS.