RUSSIAN JOURNAL OF EARTH SCIENCES, VOL. 17, ES4003, doi:10.2205/2017ES000606, 2017
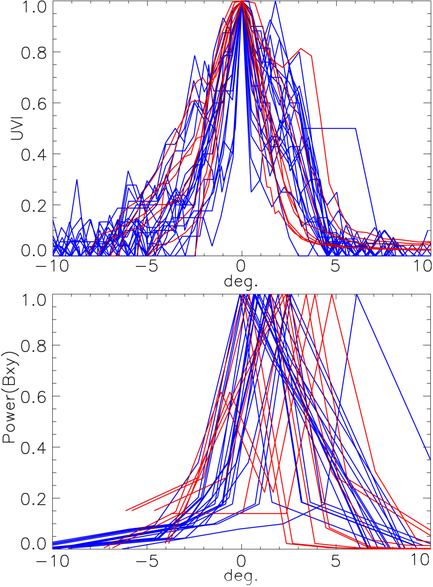
Figure 10. The latitudinal normalized distribution of UV intensity (during time intervals when Pi2 had been detected) shifted to the reference latitude 0° (upper panel). The relevant normalized latitudinal distribution of total Pi2 power (bottom panel). Red lines correspond to the POLAR observations, and blue lines correspond to IMAGE events.

![]()
Citation: Martines-Bedenko V. A., V. A. Pilipenko, M. J. Engebretson, M. B. Moldwin (2017), Time-spatial correspondence between Pi2 wave power and ultra-violet aurora bursts, Russ. J. Earth Sci., 17, ES4003, doi:10.2205/2017ES000606.
Copyright 2017 by the Geophysical Center RAS.
Generated from LaTeX source by ELXpaper, v.1.5 software package.