RUSSIAN JOURNAL OF EARTH SCIENCES, VOL. 17, ES4003, doi:10.2205/2017ES000606, 2017
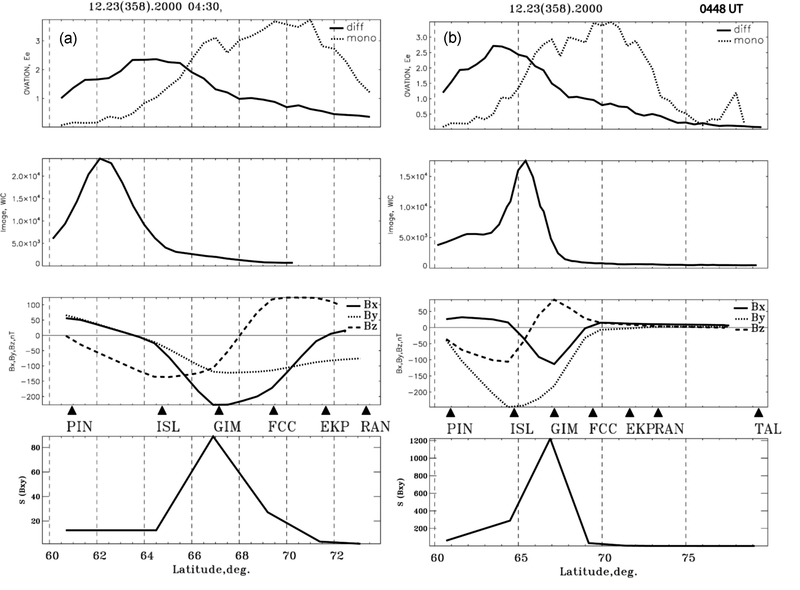
Figure 5. Latitudinal distribution on 2000 (day 358) of the particle precipitation zones (solid line denotes monoenergetic electrons, dotted line corresponds to wideband electrons) as derived from the OVATION-prime model (left upper panel); WIC intensity along the longitude $\Lambda=1.8\mbox{°}$ on 0429:22 UT (left second panel), magnetic field disturbance along the $\sim 330\mbox{°}$ profile as compared with reference field at 0423 UT (solid line – $X$ component; dashed line – $Z$ component; dotted line – $Y$ component) (left third panel) estimated for the period 0437 UT $\pm$2.5 min, and Pi2 power (left bottom panel) observed during the time interval around auroral activation (0430 UT $\pm$2.5 min). Right column: The same format as in left column but for the OVATION-prime model on 0448 UT, WIC on 0447:47 UT along $\Lambda=346.8\mbox{°}$, magnetic field disturbance along the $\sim 330\mbox{°}$ profile as compared with reference value at 0445 UT estimated for the period 0456 UT $\pm$2.5 min, and Pi2 power recorded during the time interval 0448 UT $\pm$2.5 min.

![]()
Citation: Martines-Bedenko V. A., V. A. Pilipenko, M. J. Engebretson, M. B. Moldwin (2017), Time-spatial correspondence between Pi2 wave power and ultra-violet aurora bursts, Russ. J. Earth Sci., 17, ES4003, doi:10.2205/2017ES000606.
Copyright 2017 by the Geophysical Center RAS.
Generated from LaTeX source by ELXpaper, v.1.5 software package.