RUSSIAN JOURNAL OF EARTH SCIENCES, VOL. 16, ES6006, doi:10.2205/2016ES000589, 2016
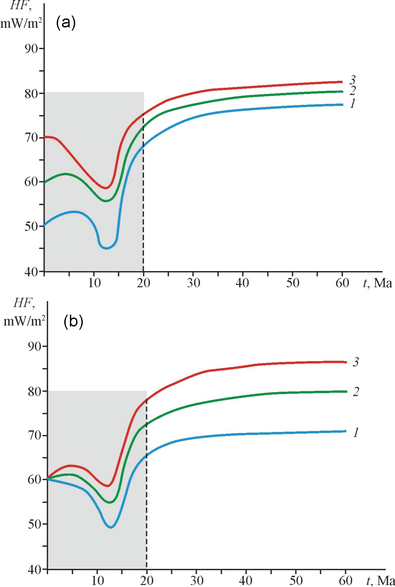
Figure 6. Surface heat flow evolution over the middle point of uplift. (a) Top picture shows the influence of different conductivities $\lambda$ ($La$): 1–2.0 (low), 2–2.5 (normal), 3–3.0 (high) W/m K. (b) Bottom picture shows the influence of different heat production rates $H$: 1–1.5 (low), 2–2.0 (normal), 3–2.5 (high) $\mu$W/m$^3$. Shaded area marks the time of shortening.

![]()
Citation: Parphenuk O. I. (2016), Thermal regime and heat transfer during the evolution of continental collision structures, Russ. J. Earth Sci., 16, ES6006, doi:10.2205/2016ES000589.
Copyright 2016 by the Geophysical Center RAS.
Generated from LaTeX source by ELXpaper, v.1.5 software package.