RUSSIAN JOURNAL OF EARTH SCIENCES, VOL. 16, ES6006, doi:10.2205/2016ES000589, 2016
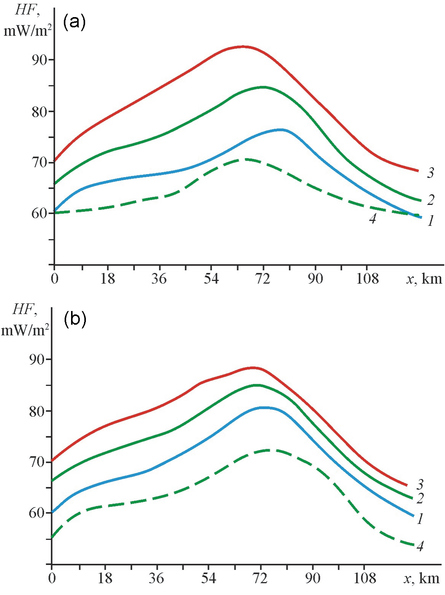
Figure 5. Surface heat flow distribution over the uplift (point 0 in horizontal direction corresponds the point $x_0$ in Figure 3) 62 Ma after the onset of shortening. (a) Top picture shows the influence of different conductivities $\lambda$: 1–2.0 (low), 2–2.5 (normal), 3–3.0 (high) W/m K. Brocken line (4) presents results for anisotropic $\lambda_x = 1.2 \lambda_y$. (b) Bottom picture shows the influence of different heat production rates $H$: 1–1.5 (low), 2–2.0 (normal), 3–2.5 (high) $\mu$W/m$^3$. Brocken line (4) presents the end of shortening for "normal" model.

![]()
Citation: Parphenuk O. I. (2016), Thermal regime and heat transfer during the evolution of continental collision structures, Russ. J. Earth Sci., 16, ES6006, doi:10.2205/2016ES000589.
Copyright 2016 by the Geophysical Center RAS.
Generated from LaTeX source by ELXpaper, v.1.5 software package.