
RUSSIAN JOURNAL OF EARTH SCIENCES, VOL. 16, ES6001, doi:10.2205/2016ES000583, 2016
Renata Lukianova
Geophysical Center RAS, Moscow, Russia
Mid-to-low-latitude ground magnetometers located on the dayside observe an unusual negative bay in the $H$-component as a direct response to the solar wind dynamic pressure (SWPd) pulse occurring during period of steadily intense southward IMF in the course of the magnetic storm main phase. Occurrence of geomagnetic depression maximizes in the postnoon sector. Geosynchronous satellite also observes a decrease of the dayside magnetic field. Simultaneous high-latitude magnetic disturbances are likely indicative of large strengthening of Region 1 field-aligned current (FAC). Observations seem to confirm the theoretical prediction that Chapman-Ferraro dynamics is replaced by Region 1 FAC dynamics when the IMF is strongly southward and SWPd is high.
The solar coronal mass ejections (CME) accompanied by the magnetic clouds with abrupt fronts mainly occur during the solar maximum. CME cause the most intense magnetic storms. Within an interplanetary cloud, both the interplanetary magnetic field (IMF) and solar wind dynamic pressure (SWPd) often share an initial rise, but they subsequently can vary dynamically and nearly independently of each other. A balance between the SWPd and the magnetic pressure exerted by the magnetosphere is achieved by dawn-to-dusk currents flowing within the dayside magnetopause (Chapman-Ferraro DCF current). A compression/rarefaction of the magnetosphere by sudden changes in SWPd is a major feature of the solar wind interaction with the Earth's magnetic field. Within a few minutes the SWPd enhancement compresses the entire magnetosphere causing an increase of the DCF current, the cross-tail current and the global field-aligned currents (FACs) which flow between the magnetosphere and ionosphere along the open-closed geomagnetic field line boundary.
Compression of the magnetopause is also a source of transient phenomena in the ionosphere. Duration of the SWPd disturbance within the solar wind determines whether its effect is localized or more global. SWPd pulse lasting a few minutes creates a localized disturbance in the magnetopause and transients in the high-latitude ionosphere. Prolonged pulses lasting tens of minutes and step changes in PSW cause sudden changes of geomagnetic field all over the world.
The well known ground signature of the enhanced DCF current is an increase of the northward ground magnetic component at low and middle latitudes. Arrival of the interplanetary cloud causes a sudden impulse or a sudden commencement (SC) followed by a magnetic storm. The main characteristic of magnetic storms is a development of the westward flowing magnetospheric ring current. An increase of the ring current causes a long-lived depression in the geomagnetic northward $H$-component mid-to-low latitudes which is measured by the $Dst$ index.
Strong SWPd pulses often occur during the magnetic storm main phase and causes significant magnetosphere-ionosphere disturbances. The general consensus is that at the dayside mid-to-low latitudes the ground magnetometers all observe a positive bay in the ($H$) component as a direct response to the increased DCF. However, it appears that in some cases, instead of the conventional positive bay, the low-latitude ground magnetometers located on the dayside observe the unusual negative bay in the $H$-component as a direct response to SWPd pulse, if the SPWd occurs during the intense magnetic storms. In the present paper we consider several case studies of the unusual mid-to-low-latitude response to SWPd pulse. The corresponding signatures inferred from the ground magnetometers and the GOES satellite measurements are presented in Section 3. The interpretation of the results is given in Section 4.
The period of 1998–2002, i.e. during the maximum of solar cycle 23, has been examined to select the events of strong SWPd pulses occurred during the intervals of relatively stable IMF. The analysis has shown that during non-storm time the mid-to- low-latitude ground magnetometers all observe a pure positive bay. Thus a possible influence of the magnetopause erosion due to the IMF turning was excluded and only the effect of pressure pulse is considered.
The SWPd is the solar wind parameter which is calculated as
\begin{eqnarray*} \mathrm{SWPd} =m \,n_\mathrm{SW} \,V_\mathrm{SW}^2 \end{eqnarray*}where $m$ is the mean ion mass, $n_\mathrm{SW}$ is the solar wind density, and $V_\mathrm{SW}$ is the solar wind speed. The high-resolution (1-min) SWPd values are available via the NASA OMNI data base (http://omniweb.gsfc.nasa.gov/).
The geomagnetic $H$ component from ground mid-to-low latitude stations covering a broad range of longitudes around the globe has been examined in order to compare the response in different magnetic local time (MLT) sectors. The 1-min values of the geomagnetic variations are taken from the World Data Centre for Geomagnetism in Edinburgh (http://www.wdc.bgs.ac.uk/catalog/master.html). The analysis has shown that during non-storm time the mid-to-low ground magnetometers all observe a pure positive bay in the $H$-component in response to SWPd pulse. Ground signature of SC is a sharp increase of the $H$-component as expected. Isolated SWPd pulse occurred in course of the storm main phase or early part of the recovery phase caused more complicated signature. Under condition of intense southward IMF the stations located in the night side recorded a positive bay in $H$ while the stations located on the day side unexpectedly show a negative bay as a direct response to SWPd pulse. The bay started with the onset and ended with the end of the pulse.
|
| Table 1 |
In total, ten events of this kind have been found. These events are listed in Table 1 along with the following parameters: duration of the pressure pulse, peak value of SWPd in the pulse, the $Dst$ index and the IMF $Bz$ averaged over three hours at the time of pressure pulse passage.
From the Table 1 one can see that the SWPd pulse which may produce the unusual geomagnetic response lasts approximately one hour and its amplitude exceeds 10 nPa. For all events the IMF is strongly southward and the $Dst$ is mostly below $-100$ nT. However, for the events of 28/02/1998 and 13/11/1998 the $Dst$ is relatively weak ($-75$ and $-40$ nT, respectively) indicating a marginal storm-time ring current.
 |
| Figure 1 |
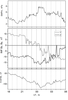
In order to demonstrate the geomagnetic response to pressure pulse the event from Table 1 on February 18, 1998 is discussed in detail. Figure 1 depicts the SWPd, IMF $Bz$ and $By$ components, and H-SYM index during the 12-hr period from 18:00 UT, February 17 till 06:00 UT, February 18. The SWPd pulse (up to 10 nPa) occurs at 00:15 UT. The IMF $Bz$ is about $-10$ nT and $-12$ nT before and after 00:00 UT, respectively. The IMF $By$ gradually rotates from plus to minus.
 |
| Figure 2 |
At high latitudes the SWPd pulse causes a strengthening of the transpolar ionospheric current and auroral electrojets. Figure 2 depicts the polar cap (PC) and the auroral electrojet ($AE$) indices for the 3-hr period from 23:00 UT 17/02 till 03:00 UT 18/02. Data are available via the NASA OMNI data base. After 00:30 UT, during the SWPd pulse, PC and AE indices increase up to 10 and 1800, respectively. Abrupt increase of the high-latitude geomagnetic indices is due to a strengthening of the magnetospheric convection and FACs connecting the magnetospheric boundaries with the high-latitude ionosphere.
 |
| Figure 3 |
 |
| Table 2 |
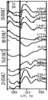
Figure 3 shows the stack plot of the $H$-component from all available ground magnetometers located between $-25\mbox{°}$ and $+25\mbox{°}$ magnetic latitude and covered a broad MLT range. The stations and its coordinates are listed in Table 2. All stations are binned into four groups according to its MLT location at the time of the magnetospheric compression by the SWPd pulse as follows: the dawn sector 03:00–09:00 MLT, dayside sector 09:00–15:00 MLT, dusk sector 15:00–21:00 MLT and night side sector 21:00–03:00 MLT. In Figure 3 these MLT sectors are indicated on the left. Vertical line indicates the onset of the SWPd pulse at 00:30. The conventional ground geomagnetic signature of the SWPd pulse is a positive bay in $H$ component. This signature is clearly seen in the 03:00–09:00 and 21:00–03:00 MLT sectors. The duration of the bay is equal to the duration of SWPd pulse. However, in the dayside and dusk sectors no positive bay is observed. Instead, the $H$ component even slightly decreases forming a negative bay. This depression in the $H$-component implies that in the region between 09:00 and 21:00 MLT the effect of the DCF current enhancement is cancelled.
The magnetic depression is also observed in the magnetosphere by the satellites. Since 1975, a series of the Geostationary Operational Environmental Satellites (GOES) locate in Earth's geographic equatorial plane, approximately 6.6 Earth radii. Among other instruments the satellites have carried magnetometers to monitor the geomagnetic field and its variations. The orthogonal flux-gate magnetometer elements provide magnetic field measurements in three mutually perpendicular components: $H_{\rm P}$, $H_{\rm E}$ and $H_{\rm N}$. $H_{\rm P}$ is perpendicular to the satellite's orbital plane, i.e. approximately parallel to the Earth's dipole. The variation of $H_{\rm P}$, if measured on the dayside, is able to provide information on the geomagnetic field change behind the subsolar magnetopause. The results of the GOES magnetic field measurements are available via the NASA data base
 |
| Figure 4 |
While during the event on February 17–18, 1998 no GOES satellites were located exactly in the dayside, the GOES-8 satellite was near the dusk at about 19:00 MLT. Figure 4 shows the local magnetic $H_{\rm P}$ component from GOES-8 for the same period as Figure 2 and Figure 3. From Figure 4 one can see that just after the high pressure front hits the magnetosphere the geosyncronous magnetic field decreased from 60 to 30 nT. Thus both the ground and space observations indicate a global depression of the dayside equatorial magnetic field in response to the magnetospheric compression due to the SWPd pulse. At the same time the high-latitude ionospheric electric field driven by FACs strengthens considerably.
 |
| Figure 5 |
 |
| Figure 6 |
Figure 5 and Figure 6 show another example of the unusual response to the SWPd pulse occurred during the main phase of the magnetic storm on September 25, 1998. Figure 5 depicts the SWPd and the IMF $Bz$ and $By$ components during the 6-hr period from 04 till 10:00 UT. Strong SWPd pulse (up to 30 nPa) hits the magnetosphere at 06:15 UT and peaks at 07:00 UT. The IMF $Bz$ is negative at the level of about $-12$ nT before 07:00 UT and $-5$ nT during the SWPd enhancement. The IMF $By$ is positive during the whole time interval. Just after arrival of the high SWPd front the high-latitude $PC$ and $AE$ indices increased up to 10 and 3000, respectively (not shown). In Figure 6 the stack plot of the low-latitude $H$-component is presented. The plot is constructed in the similar manner as in Figure 3 but using 15 available magnetometers. From Figure 6 one can see the same geomagnetic signature: in the night side a customary positive bay (e.g., up to 100 nT at HUA) is observed but in the dayside the bay is negative (e.g., down to 50 nT at LRM). For this event the GOES satellite was near midnight where it observed a positive bay in the $H_{\rm P}$ magnetic component (not shown).
 |
| Figure 7 |
Similar analysis for the events listed in Table 1 has shown the same signatures. In direct response to SWPd pulse the high-latitude electric fields and currents strengthen, the low-latitude horizontal magnetic field is depressed in the dayside but increased in the night side. Figure 7 presents distribution of the negative bay occurrence over MLTs. Vertical bar indicates the total number of events in which a negative bay was observed at a given hour. The smoothed distribution is also shown. From Figure 7 one can see that the region of geomagnetic depression is between 06:00 and 20:00 MLT with a tendency of larger depression in the dusk. The maximum of the depression occurrence is located in the postnoon sector at about 13:00 MLT. In the night local time sectors only positive bays are observed.
There is a common consensus that the ground signature of the magnetospheric compression by the high SWPd front is an increase of the northward magnetic component at low latitudes [Hargreaves, 1992; Nishida, 1978]. However, in the course of the main phase of several magnetic storms the unusual negative bays in the $H$-component from the magnetometers located in the noon/dusk MLT sector in direct response to a SWPd pulse have been observed. At the same time the nightside magnetometers observed the customary positive bays. Both types of bays are reasonably associated in terms of timing with a SWPd pulse impacted the magnetosphere. In addition to the ground magnetometers the geosynchronous satellite also observed a depression in the magnetic field in the dayside/dusk region. It implies that the effect is global.
The high-latitude geomagnetic indices strongly increase during the passage of the SWPd pulse. It is indicative of a global enhancement in high-latitude ionospheric currents, polar cap convection and the Region 1 FAC. The process is most efficient when the IMF is southward. The unusual negative perturbation in the low latitude $H$-component can be due to increased Region 1 FAC that results from the magnetospheric compression. Previous studies have shown that, if the SWPd enhancement occurs during southward IMF, the response of mid-to-low latitudes to enhanced DCF current is considerably reduced by the magnetic effect of enhanced Region 1 FACs [Lukianova, 2003, 2007; Russell et al., 1994; Zesta et al., 2000].
On the theoretical side, Siscoe at al. [2002] studied a phenomenon of transpolar potential saturation. MHD simulation showed that the Region 1 current system usurps the position of DCF current. The authors suggested that under intense southward IMF condition, when intense dayside reconnection occurs, there is a limit on the Region 1 FAC set by the amount of current required to provide the Lorentz force needed to balance the solar wind ram pressure on the magnetopause. Whereas DCF current system strengthens the magnetic field at the subsolar magnetopause, the Region 1 current system weaken it. Observations are seemed to confirm, for the first time, the theoretical prediction that Chapman-Ferraro dynamics is replaced by Region 1 system dynamics when the IMF is strongly southward and SWPd is high.
In addition to effect of FACs, a negative bay could be considered as a manifestation of the ring current influence that leads to a local decrease of DCF current in the subsolar region of the magnetopause. It is because in the dayside low-latitude region the magnetic flux between the ring current and magnetopause current increases, while the subsolar point of the magnetopause shifts significantly earthward due to PSW sudden increase.
In the set of events considered above the negative bays were detected in the postnoon sector. It is in accordance with a spiral IMF/SW orientation for which high pressure front strikes the postnoon magnetopause. Based on Figure 6, one can expect the SWPd front orientation to control the local time on the globe where signatures occur. Riazantseva et al. [2003] studied the orientation of high pressure fronts using multisatellite observations. These authors found the orientation of SW structure along Parker spiral is more common. Average inclination perpendicular to the Sun–Earth line is about $30\mbox{°}$ and that is less than the inclination of the IMF discontinuities. During typical periods of spiral IMF orientation the pressure fronts predominantly strike the postnoon magnetopause.
Examination of the storm-time events of SWPd pulse occurred during periods of steady intense southward IMF has shown the unusual signatures of low-to-mid latitude geomagnetic disturbances. Magnetometers located on the dayside observe a depression in the $H$-component as a direct response to the SWPd pulse, while the night side magnetometers observe a customary positive bay. Occurrence of geomagnetic depression maximizes in the postnoon sector. Geosynchronous satellite also observes a decrease of the dayside magnetic field. Simultaneous high-latitude magnetic disturbances are indicative of large strengthening of Region 1 FACs. Observations seem to confirm, for the first time, the theoretical prediction that Chapman-Ferraro dynamics is replaced by Region 1 FAC dynamics when the IMF is strongly southward and SWPd is high.
Hargreaves, J. K. (1992), The Solar-Terrestrial Environment, 420 pp., Cambridge University Press, Cambridge, doi:10.1017/CBO9780511628924.
Lukianova, R. (2003), Magnetospheric response to sudden changes in solar wind dynamic pressure inferred from polar cap index, J. Geophys. Res., 108, no. A12, p. 1428.
Lukianova, R. (2007), Comment on "Unified PCN and PCS indices: Method of calculation, physical sense, and dependence on the IMF azimuthal and northward components" by O. Troshichev, A. Janzhura, and P. Stauning, J. Geophys. Res., 112, no. A7, p. A07204, doi:10.1029/2006JA011950.
Nishida, A. (1978), Geomagnetic Diagnosis of the Magnetosphere, 256 pp., Springer-Verlag, New York, doi:10.1007/978-3-642-86825-2.
Riazantseva, M. O., P. A. Dalin, G. N. Zastenker, J. Richardson (2003), Orientation of sharp fronts of the solar wind plasma, Cosmic Res., 41, no. 4, p. 382, doi:10.1023/A:1025061711391.
Russell, C. T., M. Ginskey, S. M. Petrinec (1994), Sudden impulses at low latitude stations: Steady state response for southward interplanetary magnetic field, J. Geophys. Res., 99, p. 253, doi:10.1029/93JA02288.
Siscoe, G. L., N. U. Crooker, K. D. Siebert (2002), Transpolar potential saturation: Role of region 1 current system and solar wind ram pressure, J. Geophys. Res., 107, no. A10, p. 1321.
Zesta, E., H. Singer, D. Lummerzheim, C. Russel, L. R. Lyons, M. Brittnacher (2000), The effect of the January 10, 1997 pressure pulse on the magnetosphere-oinosphere current system, Magnetospheric Current Systems, ed. by S. Ohtani and R. Lysak, p. 217, AGU, Washington, doi:10.1029/GM118p0217.
Received 20 November 2016; accepted 23 November 2016; published 29 November 2016.

Citation: Lukianova Renata (2016), Unusual geomagnetic response to the solar wind dynamic pressure pulse during storm-time, Russ. J. Earth Sci., 16, ES6001, doi:10.2205/2016ES000583.
Copyright 2016 by the Geophysical Center RAS.