RUSSIAN JOURNAL OF EARTH SCIENCES, VOL. 16, ES5005, doi:10.2205/2016ES000581, 2016
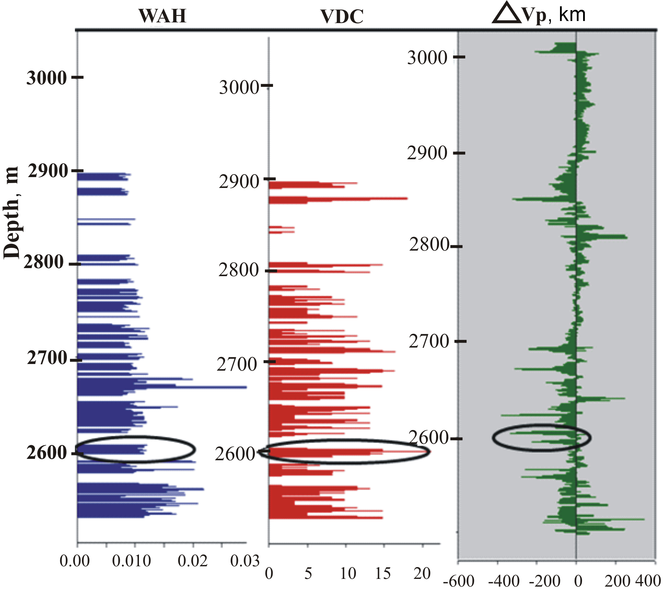
Figure 12. The plot shows more negative values of VDC in zones with high fracture aperture and so high fracture density velocity deviation. VAH controlled deviation of VDL values.

![]()
Citation: Soleimani Bahman, Khayyam Amiri, Babak Samani, Leila Shaban (2016), Lithology effects on the fractures parameters using image log and petrophysical data, Russ. J. Earth Sci., 16, ES5005, doi:10.2205/2016ES000581.
Copyright 2016 by the Geophysical Center RAS.
Generated from LaTeX source by ELXpaper, v.1.5 software package.