RUSSIAN JOURNAL OF EARTH SCIENCES, VOL. 16, ES3002, doi:10.2205/2016ES000572, 2016
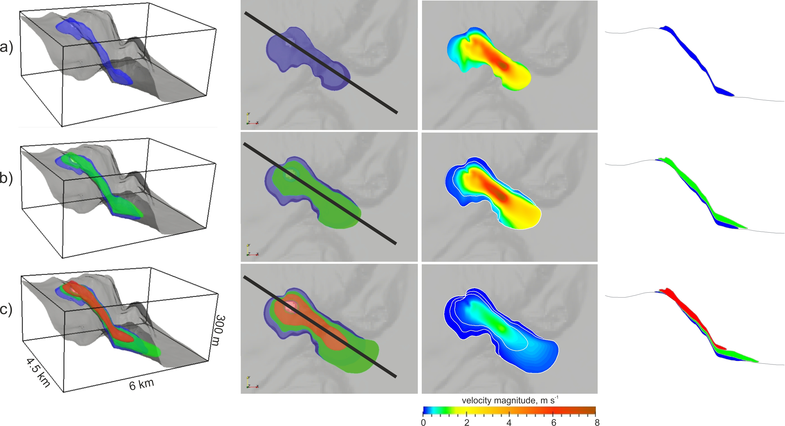
Figure 3. Lava flow snapshots at times 9000 s (a), 33000 s (b), and 63000 s (c). Blue-, green-, and red-colored lavas are modeled fluids 1, 2, and 3, respectively (see Table 1 for their physical properties). Each time snapshot presents three views: a 3-D view (left panels), a view from the top (middle-left panels), and a cross-section view (right panels) as well as the velocity magnitude (middle-right panels). The black solid lines (in the middle-left panels) present the position of the cross section. The white curves (in the middle-right panels) show the extend of lava flow at the end of the second and third episodes of lava effusion. After Tsepelev et al. [2016].

![]()
Citation: Ismail-Zadeh A. T. (2016), Geohazard research, modeling, and assessment for disaster risk reduction, Russ. J. Earth Sci., 16, ES3002, doi:10.2205/2016ES000572.
Copyright 2016 by the Geophysical Center RAS.
Generated from LaTeX source by ELXpaper, v.1.5 software package.