RUSSIAN JOURNAL OF EARTH SCIENCES, VOL. 15, ES3002, doi:10.2205/2015ES000553, 2015
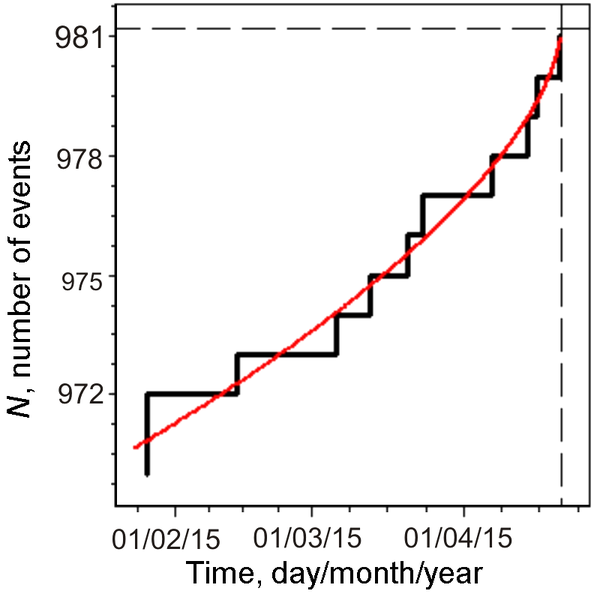
Figure 8. The picture shows the time variation of a cumulative number of events (black stair-step curve) inside the 300-km radius epicenter of the $M=6.6$ earthquake in Taiwan, for the period 26 January 2015 – 20 April 2015, based on the NEIC/USGS catalog. Dash lines indicate the vertical and horizontal asymptotes. The vertical asymptote gives estimation of origin time ($T_0$) of the main event.

![]()
Citation: Wu Hong-Chun, Ivan N. Tikhonov, Ariel R. Césped (2015), Multi-parametric analysis of earthquake precursors, Russ. J. Earth Sci., 15, ES3002, doi:10.2205/2015ES000553.
Copyright 2015 by the Geophysical Center RAS.
Generated from LaTeX source by ELXpaper, v.1.3 software package.