RUSSIAN JOURNAL OF EARTH SCIENCES, VOL. 14, ES2005, doi:10.2205/2014ES000542, 2014
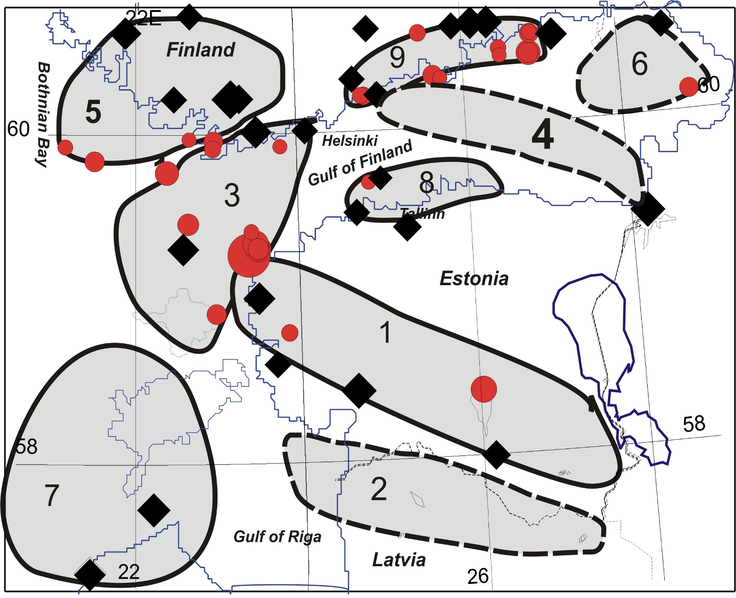
Figure 8. Seismotectonic zoning map. Areal zones are contoured by solid and dotted lines that means reliable or unreliable revealing respectively. Diamonds show representative historical earthquakes from 1670 to 1957, circles show representative events of instrumental period from 1958 to 2012. The size of sign is proportional to the earthquake magnitude $M / 5$ in the range of $1.6 - 4.7$.

![]()
Citation: Assinovskaya B. A., M. K. Ovsov (2014), Seismotectonic zoning of the Finnish–Bothnia region based on the structural analysis method, Russ. J. Earth Sci., 14, ES2005, doi:10.2205/2014ES000542.
Copyright 2014 by the Geophysical Center RAS.
Generated from LaTeX source by SemTeXML, v.1.2 software package.