RUSSIAN JOURNAL OF EARTH SCIENCES, VOL. 14, ES1002, doi:10.2205/2014ES000536, 2014
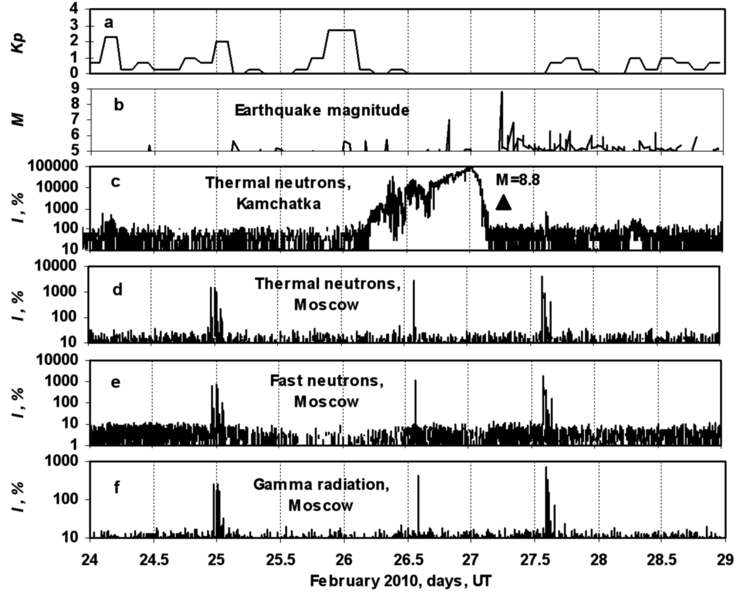
Figure 3. Temporal variations on February 24–29: a – $Kp$ index; b – earthquake magnitude ($M$), c – thermal neutron flux intensity, recorded at the station in Kamchatka, d–f – thermal and fast neutron and gamma radiation flux intensity, recorded in Moscow.

![]()
Citation: Shestopalov I. P., E. P. Kharin (2014), Relationship between solar activity and global seismicity and neutrons of terrestrial origin, Russ. J. Earth Sci., 14, ES1002, doi:10.2205/2014ES000536.
Copyright 2014 by the Geophysical Center RAS.
Generated from LaTeX source by SemTeXML, v.1.2) software package.