RUSSIAN JOURNAL OF EARTH SCIENCES, VOL. 14, ES1002, doi:10.2205/2014ES000536, 2014
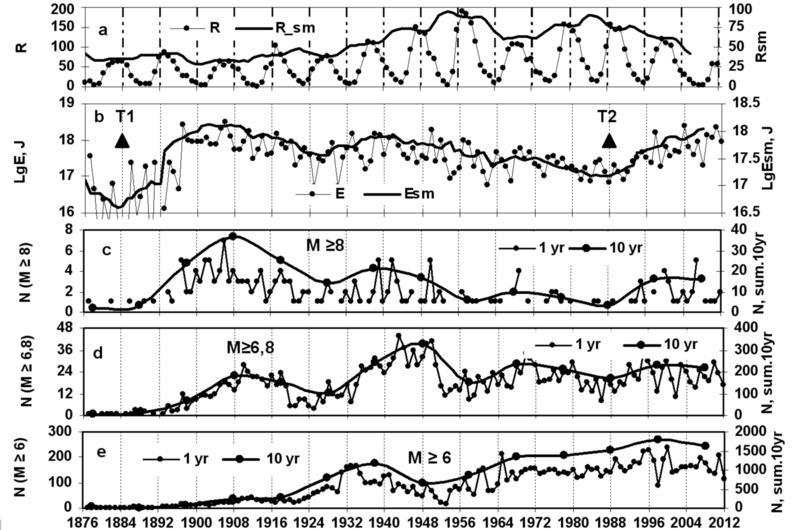
Figure 1. Temporal variations in 1876–2012: a – mean annual values of Wolf numbers ($R$, left-hand side scale) and smoothed ones based on 11 values ($R_{\rm sm}$, right-hand side scale); b – summarized annual values (left-hand side scale) and smoothed ones based on 9 values (right-hand side scale) of earthquake energy on the globe; c–d the number of earthquakes per year (left-hand side scale) and for 10 years (right-hand side scale): c – of $M \geq 8$; d – of $M \geq 6.8$; e – of $M\geq 6$. Symbols T1 and T2 on curve b indicate minimal values of seismic energy in a centennial cycle.

![]()
Citation: Shestopalov I. P., E. P. Kharin (2014), Relationship between solar activity and global seismicity and neutrons of terrestrial origin, Russ. J. Earth Sci., 14, ES1002, doi:10.2205/2014ES000536.
Copyright 2014 by the Geophysical Center RAS.
Generated from LaTeX source by SemTeXML, v.1.2) software package.