E. V. Lysenko, G. G. Nelidova, and V. Ya. Rusina
Central Aerological Observatory, Dolgoprudny, Moscow Region, Russia
The origin of the temperature trends observed in various atmospheric layers is a crucial point in the problem of global changes of the Earth's climate. The fact of the temperature increase in the near-ground air approximately by 0.5 K during the last century is considered quite skeptically by many climatologists since the secular climatic changes considerably exceed this increase. However, the variations that occurred in the middle atmosphere during the recent 3-5 decades, which are covered by observations demonstrate convincingly that this is not an occasional event but a developing process of climate warming. There are serious arguments to relate this process with increased industrial activity All (without any exception) theoretical studies show that the greenhouse gas concentration increase in the atmosphere leads to a heating of the near-ground air layer and troposphere and intensive cooling of the middle and upper atmosphere. The very intensive cooling of the stratosphere and, especially, mesosphere was derived during the recent decade from the results of radiosonde, rocket, satellite, lidar, radiophysical, and optical observations. The cooling considerably exceeds the natural temperature variability level and is a serious argument in favor of the increasing greenhouse effect hypothesis.
However, the actual cooling of the middle atmosphere during the past decade exceeds considerably the theoretical forecast, with greenhouse gas concentration in the atmosphere doubled (which according to expert estimates is expected only in the middle of the 21st century). This very serious discrepancy may be related to both obvious limitations of model simulations and the presence of other factors influencing the climatic system. Nevertheless, the results similar to the observed temperature variations in the stratosphere and mesosphere were obtained in a series of theoretical studies. For example, the results of numerical simulation performed by three groups of authors [Rosenfield et al., 1988; Schwarzkopf and Fels, 1985; Shine, 1987] were presented in WMO [1988]. They estimated temperature variations in the middle atmosphere due to vertical ozone profile variations obtained from the measurements by the SBUV satellite equipment during 1979-1986 (in this case the accuracy of these measurements does not matter). Though the temperature variations over the North Pole in June and over the equator in March were modelled, the results are very close to the annual mean vertical distribution of the temperature linear trend over the Volgograd and Balkhash midlatitude rocket stations both qualitatively and quantitatively [Kokin and Lysenko, 1994; Kokin et al., 1990]. Mahlman et al. [1994] estimated global temperature variations in the middle atmosphere due to the ozone layer exhaustion over the Antarctic and also obtained results similar to observations in the middle and upper stratosphere over the Molodezhnaya station, where a positive temperature trend was detected in spring [Kokin and Lysenko, 1994; Kokin et al., 1990]. And, finally, the numerical simulation of the middle atmosphere climate under doubled carbon dioxide content [Rind et al., 1990] showed that in winter, a positive temperature trend should be observed in the upper stratosphere at high latitudes of the Northern Hemisphere. Kokin and Lysenko [1994] and Kokin et al. [1990] also registered this phenomenon, only not at high but at middle latitudes.
The similarity of these independent results required a deep analysis of rocket measurement data to provide a detailed study of the annual behavior of the temperature trend at various height levels in the middle atmosphere.
To study long-term variations of this or that atmospheric parameters on the background of strong enough regular and quasi-regular variations and noise, one needs a representative enough set of statistically homogeneous data covering a temporal interval much longer in duration than the periods of the most pronounced oscillations. Moreover, a method of statistical analysis effective enough to "filter out" these oscillations and estimate small, systematic variations of the parameter on the background of the residual noise is also needed. The background level is determined not only by the accuracy of the measurement equipment and possible changes in measurement conditions and methods, but by the proper atmospheric noise as well, including diurnal, day-to-day, and year-to-year variabilities.
Long-term temperature variations in the middle atmosphere from the rocket data [Kokin and Lysenko, 1994; Kokin et al., 1990; Lysenko et al., 1997a, 1997b] were estimated using the adaptive system of statistical analysis described in detail by Rozenfeld [1986]. The principal idea of the analysis method is based on the fact that a temporal succession of observed data may be presented as a superposition of regular harmonic oscillations with various periods, trend, and residual noise:
| (1) |
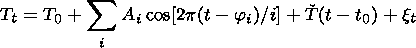
where Tt is the temperature in the moment t, T0 is the temperature at the observation beginning t0, Ai is the amplitude of the temperature oscillations with the period of i months, ji is the phase of the oscillations with the period of i months (the oscillation maximum month is counted out from 1 January so that 1 corresponds to 1 January, 1.5 corresponds to 16 January, 2 corresponds to 1 February, and so on); T is the temperature linear trend; and xt is the component of the residual noise at the moment t.
It should be noted here that, if all meaningful regular oscillations are taken into account, the dispersion of the residual noise would depend only on the natural temperature variability dT and random measurement error sTm:
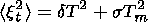 | (2) |
It follows from (2) that if the random measurement error meets the condition
 | (3) |
the residual noise would be almost completely determined by the natural atmospheric variability level.
The initial content of basis harmonics is taken a priori and then is reconsidered according to the results of the spectral-correlation analysis of the residual noise. The presence of considerable regular components in the residual noise diminish significantly the accuracy of trend estimates. Therefore, reliable conclusions on the trend may be formulated only after determination of the total spectrum of regular oscillations. To do this, the spectra of power with Hemming window and the spectra of maximum entropy of the residual noises are calculated. The pronounced spectral maxima are checked for "regularity," that is, harmonics of corresponding periods are included into the basis functions. If the corresponding amplitudes are considerable and the maxima in the residual noise spectrum disappears completely or partially, then the corresponding oscillations are considered as significant.
In the analysis process, the density distribution of the residual noise probabilities (for which the Gram-Charlie and Pirson approximations are matched) is also studied. The relation between the empirical dispersion of the estimated components of the temporal series (the dispersion value is proportional to the dispersion of the residual noise) and the components themselves demonstrate statistical significance of the estimates obtained.
Kokin and Lysenko [1994], Kokin et al. [1990], and Lysenko et al. [1997a, 1997b] used for their analysis monthly mean values of the temperature at altitudes of 25, 30, 35, ..., 75 km obtained based on the weekly, as a rule, launches of meteorological rockets M-100B during the entire period of regular atmospheric sounding at the Heiss Island (81o N, since April 1964), Volgograd (49o N, since October 1965), Balkhash (47o N, since January 1973), Tumba (8o N, since January 1971), and Molodezhnaya (68o S, since August 1969) stations. In this paper, the evaluation of the linear temperature trend for each calendar month of a year was carried out from the sounding data at the Heiss Island, Volgograd, Tumba, and Molodezhnaya stations. Since the trend itself is nonlinear [Lysenko et al., 1997a], for correct comparison of the trends estimated in various latitudinal zones, the data obtained before 1969 (beginning of the sounding at the Molodezhnaya station)at the Heiss Island and Volgograd stations were not used in the analysis.
Unlike the estimates of the annual and seasonal mean trends obtained earlier from monthly data on the temperature [Kokin and Lysenko, 1994; Kokin et al., 1990; Lysenko et al., 1997a] the trends for each month were evaluated from the weekly rocket measurements. Since the average month duration exceeds 4 weeks, to increase statistics, the data of the fifth week adjacent to the next month were also used. For example, for Januaries and Februaries, the trend estimates were carried out from the temporal series of the data for the first through ninth weeks of each year, respectively, and so on sequentially for the pairs: March-April, May-June, et cetera. Thus, the temporal series analyzed for 1969(1971)-1993(1995) contained approximately 110-130 temperature values, depending on the duration of the station functioning. The calculation model except the linear trend included one of the most pronounced period of regular oscillation (the period was determined from the spectral analysis results) and residual noise. It should be noted that omitting this oscillation did not change the trend estimate, but led only to an increase of the dispersion of the residual noise and, respectively, of the confidence interval of the trend estimates obtained.
Linear temperature trends were calculated for each calendar month at the levels of 25 trough 75 km. Later on, for more detailed analysis of the trend vertical profile in the regions of the middle atmosphere where the trend estimates had different signs, the calculations were performed with the step of 1 km.

|
| Figure 1 |

|
| Figure 2 |
One can see from Figure 1 that at heights of 60-75 km, the trend is negative in all months. At high and middle latitudes, the negative trend increases from the last spring month to the beginning or end of winter. The maximum values of the negative trend were observed in February-March at height of 60-70 km over Heiss Island and in December over Volgograd (middle latitudes). In January, the trend decreased abruptly down to the smallest absolute values at heights of 70-75 km. The trend over the Molodezhnaya station at the end of winter and the beginning of spring is approximately the same as at the end of autumn and the beginning of winter. The lowest values of the negative trend in the middle and upper mesosphere are observed in the beginning of summer and winter over Tumba (low latitudes).
In the lower mesosphere and around stratopause, the trend estimates are close to zero from the middle of spring until the middle of summer according to the data of all stations and until the middle of autumn according to the high-latitude station data. Then the negative trend increases up to the maximum values in winter. In the height layer in question a positive trend appears in the Molodezhnaya data at the end of winter and in the beginning of spring. The statistical significance of each particular positive estimate of the trend is small (of the order of 60-70%). However, Figure 1 shows that the temporal interval and statistical significance of the positive estimates increase with a height decrease, reaching a maximum at 30-35 km. Occurrence of positive estimates of the stratospheric temperature trend over Volgograd (November-December, February) and Heiss Island (December, February) is detected below 45 km. Maximum estimates of the positive trend (0.44-0.75 K yr -1 ), with the significance level above 99%, are observed at heights of 35, 40, and 45 km in December over Volgograd. In December and February maximum estimates of the positive trend over Heiss Island are 0.28-0.32 K yr -1 at 35-40 km with the confidence of ~80%. It is significant that in these very months, the negative trend in the mesosphere over Heiss Island and Volgograd also reaches its maximum. The negative trend over the Molodezhnaya station at the end of spring has maximum values at all mesospheric levels.
On the whole, the vertical profiles of the temperature trends in the nontropical middle atmosphere have definite peculiarities for conventionally summer and winter months. In summer, the trend values from 25 to ~55 km are negative, only slightly vary with height, and are about 0.1-0.3 K yr -1. Above 55-60 km, the monthly negative trends begin to increase, reaching values from -0.9 to -1.6 K yr -1 at an altitude of 75 km. In winter the negative trends decrease with an altitude increase from 25 to 35-40 km and in some months cross the zero line into the region of positive means. Above an altitude of 45-50 km they move quickly to the maximum negative values at altitudes of 70-75 km (Molodezhnaya and Heiss Island) or 60-65 km (Volgograd). With deviations from this scheme, May-September (Heiss Island and Volgograd) and January-May (Molodezhnaya) were taken as conventionally summer months and November-March (Heiss Island and Volgograd) and July-November (Molodezhnaya) were taken as conventionally winter months.

|
| Figure 3 |

|
| Figure 4 |
The thickness and height location of the layer with positive
trend
over the Molodezhnaya station (Figure 4) are approximately the same
as over Heiss Island. But the seasonal duration is significantly
longer: since the last winter month until the first summer month
when the maximum (0.21 K yr-1 under statistical
significance above 99%) descends down to the height of about 25 km.
Moreover, the trend estimates above 45-50 km do not tend to their
maximum negative values in the middle and upper mesosphere, but
only slowly shift into the region of negative values. In spite of a
low level of statistical significance of each individual trend
estimate for a particular month and altitude level, one can
distinctly see in Figure 4 that the negative trends in the 50-60 km
layer decrease smoothly at the end of winter and move into the
region of positive values at the end of spring and in the beginning
of summer (see also Figure 1). The maximum positive trend
( 0.28  0.07 K yr-1 )
is observed in December at an altitude of 55 km, though
positive trends are also seen in Figure 1 in the beginning of
winter (June). It should be noted here that the months of
winter-spring calendar period (for the Molodezhnaya station) and
autumn-winter period (for the Heiss Island and Volgograd stations)
are referred as conventionally winter months (according to the
character of the vertical trend profile).
0.07 K yr-1 )
is observed in December at an altitude of 55 km, though
positive trends are also seen in Figure 1 in the beginning of
winter (June). It should be noted here that the months of
winter-spring calendar period (for the Molodezhnaya station) and
autumn-winter period (for the Heiss Island and Volgograd stations)
are referred as conventionally winter months (according to the
character of the vertical trend profile).
First of all, we return to the data presented in Figure 2 and discuss a potential ability to reveal climatic temperature trends in the stratosphere and mesosphere rocket measurements, which have the random error from 2.7 K at 20-45 km to 6 K at 65-70 km [Lysenko et al., 1982]. In this figure, apart from the empirical root mean square errors of calculations of the trend (obtained on the basis of analysis of the probability distribution of the residual noise), the result of a rough estimate of s from the data on the natural temperature variability over the Haute Provence (44oN) observatory is shown. These data for each month of a year have been obtained in the lidar observations during 1984-1989 and were published by Hauchecorne et al. [1991]. The random error of lidar measurements of the temperature in the region 30-70 km does not exceed 1 K and increases up to 3 K at 80 km [Hauchecorne et al., 1991].
The s value was estimated for 5 measurements in each month of a year during 27 years, which approximately corresponds to the regime of rocket observations. It follows from Figures 2a and 2b that the calculation results agree well with the empirical dispersion of trend estimates over the midlatitude station Volgograd especially in the autumn-winter period. In the spring-summer period, the empirical data at 45-65 km exceed the calculated data by a factor of 1.5-2. That means that in the autumn-winter period at middle latitudes, the natural temperature variability dT is considerably higher than the instrumental error of rocket measurements sTm in the entire height region and completely determines the error of trend estimates (see relation (2)). In the spring-summer period at 45-65 km, the instrumental error is comparable (and even higher than) the level of natural variability. This conclusion is confirmed by direct comparison of dT and sTm. For example, according to Lysenko et al. [1982], sTm is 5.7 K at an altitude of 60 km and according to Hauchecorne et al. [1991], the dT values increase from 2.4 K in April and June to 8.9 K in December.
Thus, with the existing level of natural temperature variability in the middle atmosphere, the accuracy capacities of measurements by meteorological rockets M-100B meet the requirements of maximum reliable revealing of trends (at least outside the tropic zone), the fact being confirmed by the data shown in Figure 2. A hypothetical reduction of the random error level of rocket measurements would have been able to decrease the empirical dispersion of the trend estimates only in summer and only in the 45-65 km layer. The increase of the temporal base of the observations conducted is the only possibility for decreasing the empiric dispersion of trend estimates.
The trend estimates obtained for each month show first of all that there is an annual behavior of the temperature trend at all levels in the stratosphere and mesosphere. That means that the annual temperature behavior has changed during the period studied. It looks quite obvious that the variation of annual temperature behavior should correspond to the trend estimates for each month obtained from the same measurement data. The opposite statement is also true: the estimates of monthly trends should correspond completely to the variation of the annual temperature behavior during the observational period in question. However, in the procedure aspect of the analysis of the temporal series of observation, a total conformity of the estimates is not obvious. In one version, only the trend for particular season is determined from the temporal series of temperature values. Apart from the trend, this series contains only weak, low-frequency component and the noise caused by the atmospheric temperature variability in this season and the instrumental error of the measurement equipment. In the other version, the temporal series of temperature values during several years contains, apart from the aforementioned components, strong seasonal variations also. One has not only to evaluate these variations, taking into account the annual mean trend, but to determine their evolution during the entire period studied. Herein the empirical dispersions of the annual mean trend estimates and harmonic characteristics by which the annual temperature behavior is approximated are mutually related.
This version of treatment of rocket measurements was realized by Lysenko et al. [1997a, 1997b]. The estimates of linear trends [Lysenko et al., 1997a] and characteristics of annual and semi-annual harmonics [Lysenko et al., 1997b] were obtained in the above papers using 13-year running intervals out of the total temporal temperature series. It was found that in the middle atmosphere, both the trend of the annual mean temperature and its annual and semi-annual oscillations, that is, the annual temperature behavior itself, vary in the course of time. The results obtained were presented in the form of variations of the amplitude and phase of corresponding harmonics according to model (1).

|
| Figure 5 |
It follows from Figure 5 that a temperature increase occurs over Volgograd in autumn-winter and over Molodezhnaya in spring-summer (the temporal scale for the Molodezhnaya station was shifted by 6 months as in Figure 1). Unlike the direct estimates, the calculated temperature trend in the midlatitude stratosphere in January has nearly the same positive values as in adjacent months of the autumn-winter period. This is quite clear since the approximation of the annual temperature behavior was performed by superposition of only two harmonics. Probably, the temperature oscillations with periods shorter than 6 months play an important role in the occurred variation of the temperature annual behavior. Due to the same cause, evidently, the temperature trend in the stratosphere over Heiss Island has no positive values, though the annual trend itself (Figure 5) is similar to the trend shown in Figure 1.
It is worth noting that at the height of 40 km over the low-latitude station Tumba (where according to Lysenko et al. [1997b] there is no changes of characteristics of the annual and semi-annual oscillations), the direct estimates of the temperature trend differ in individual months from the annual mean values approximately by a factor of 1.5. At the height of 55 km, where the variation of the annual temperature behavior is caused only by variation of the phase of the annual harmonics [Lysenko et al., 1997b], manifestations of high-frequency oscillations are clearly seen in Figure 1. At the same height over the Molodezhnaya station, where direct estimates of the trend give positive values in the beginning of summer and winter, the amplitude increase of the annual and semi-annual harmonics [Lysenko et al., 1997b] leads to the temperature increase in these seasons (Figure 5). Thus, the calculations show that the estimates of monthly trends from the variations of the annual temperature behavior agree fairly well with the direct estimates of the monthly temperature trends.
On the whole, the results obtained confirm the conclusion of Kokin and Lysenko [1994] and Kokin et al. [1990] on the presence of positive trends in the winter stratosphere over Volgograd and in the spring stratosphere over Molodezhnaya. Contrary to Kokin and Lysenko [1994] and Kokin et al. [1990], positive trends are also obtained in the winter stratosphere over Heiss Island. It should be noted that from data of both the Volgograd and Heiss Island stations in January, the temperature trend has high enough negative value in contrast to the positive values of the trend in December and February.
It has been already mentioned in the Introduction that a positive temperature trend in the upper stratosphere in winter was obtained in the numerical modelling of the climate of the middle atmosphere with doubled content of carbon dioxide [Rind et al., 1990]. According to the calculations, the region with positive trend was located northward of 60o N at heights of 35-55 km, with maximum values at 80-90o N. According to the rocket data, the region with positive trend is located below 50 km with approximately the same layer thickness. The positive trend over the midlatitude Volgograd station is higher than over the high-latitude Heiss Island station. However, the fact that the modelling also give a sharp trend contrast in adjacent months of the autumn-winter season looks very interesting: the trend is positive in November, January, and February, whereas a considerable negative trend is seen in December (see Rind et al. [1990], Figure 2b).
Positive value of the trend in the 34-47 km layer with a maximum of 0.5 K yr -1 at 41 km was obtained by Keckhut and Kodera [1999] analyzing the rocket data from the Ryori (39o N, 141o E), Japan, site for nearly the same 25-yr period. This result agrees very well with the December trend over Volgograd. Lowering of the maximum as well as the absence of positive trend over Ryori in November and February is, most probably, caused by the fact that Volgograd is located 10o northward, though the 100o-difference in longitude also may play some role.
In the theoretical paper by Mahlman et al. [1994] where the atmospheric reaction on the depletion of the ozone layer over the Antarctic is numerically modelled, it is noted that the strong cooling of lower Antarctic stratosphere late in spring is accompanied by a strong heating of the middle and upper stratosphere. According to Mahlman et al. [1994], in November and December the positive trend maximum is situated over the pole at heights of 30-40 km, and the trend value is about 0.4 K yr -1 at latitudes of 65-70o S in December. In spite of a good agreement of these results with the data of rocket observation at the Molodezhnaya station, it should be noted that the positive temperature trends in the middle and upper stratosphere appear late in winter but not late in spring, as follows from Mahlman et al. [1994]. In September the positive trend reaches its maximum value (Figure 4). Moreover, the heating of lower mesosphere not noted by Mahlman et al. [1994] occurs at the end of spring and in the beginning of summer. These differences may be of great importance in the conceptual aspect.
The monthly trend estimates obtained allowed us to make correct
comparison of the mesospheric cooling rates from the rocket and
radiophysical observations in summer (May-August). According to
Taubenheim et al. [1997],
in the summer of 1963-1995, the
linear trend in the mean temperature in the 50-82-km layer was
-0.58 0.09 K yr
-1 at a latitude of 50o N. From the Volgograd
station data during 1969-1995, in the same months, the linear trend
in the mean temperature in the 50-75-km layer
was
-0.42 0.16 K yr
-1 (in both cases the 95% confidence intervals are shown). If
one extrapolates the vertical trend distribution up to 80 km, the
estimated mean temperature trend in the 50-80-km layer would be
-0.59 K yr-1. If one assumes that at 80 km the trend has the same
value as at 75 km, the mean temperature trend in the 50-80-km
layer would be
-0.52 K yr-1. Apparently the estimate of the linear
temperature trend in the summer midlatitude mesosphere would lie
exactly within these limits (from
-0.5 to
-0.6 K yr-1 ) under
increase of rocket sounding height up to 80 km. In any case (if
only the trend at 80 km does not have a positive value, which has
been derived from the observations of the increased appearance
frequency of noctilucent clouds
[Gadsden, 1990]
and from
the rotational temperatures of the hydroxyl emission
[Semenov, 1996]),
the estimates of the mean cooling rate of the
summer mesosphere from two types of long-term observations
(radiophysical and rocket) are in very good agreement.
The analysis of the temperature trend seasonal variations in the
middle atmosphere makes it possible to suggest a cause of the
discrepancy of the trend estimates in the mesosphere from rocket
and lidar measurements. The annual mean trend derived from the
lidar data in the 50-75 km layer during 1979-1989 is
-0.22 K yr
-1 [Hauchecorne et al., 1991],
this value being by a factor
of 2-3 lower than the estimates from rocket and radiophysical
observations. In the later paper by
Keckhut et al. [1995],
the monthly linear trends from the lidar measurements during
1979-1991 are estimated and the vertical profile of the trend in
summer (April-September) is presented. The calculations show that
the mean value of this trend in the 50-75-km layer is
-0.28 0.33 K yr-1.
From the rocket measurements in April-September, the
mean trend value is
-0.46 0.17 K yr-1.
Keckhut et al. [1995]
state that the maximum cooling ( >0.4 K yr-1 ) and a
small heating of the 55-75-km layer occur in August and May,
respectively. As has already been mentioned above, the smallest
negative temperature trend of the mesosphere according to
rocket
measurements is also observed in May-June (the trend value over
Volgograd at a height of 55 km in May is
0.007 0.142 K yr-1 ).
However, one can see from Figure 1 that the largest values of the
negative trend take place not at the end of summer, but in the
autumn-winter period with a maximum in December. The season does
not principally influence the results of rocket measurements by the
contact method. This fact makes it possible to state that the
negative temperature trend in the mesosphere is by about a factor
of 1.5 higher in the autumn-winter period than in summer (only in
January the trend is by a factor of 1.2 lower than in August). At
the same time, seasonal conditions of observations
probably
influence in an
uncontrolled way the measurement result in the remote sounding
method of lidar measurements. Apparently, the conditions for
conducting ground-based lidar observations in the autumn-winter
period are worse than in May-August.
The following should be also added. The analysis of the vertical distribution of the trend estimate empirical errors from the lidar measurements shows that up to a height of 70 km, the errors agree with the random measurement error of the temperature claimed by Hauchecorne et al. [1991], observation duration, and the data on natural temperature variability. This agreement, formulated by relation (2), is broken above 70 km, and that indicates a sharp increase of the actual measurement error of the temperature. One can assume that the presence in lidar measurements of the uncontrolled error (systematic in season sense and random by its nature) is a cause of both underestimated evaluations of the negative temperature trend of the mesosphere on the whole and positive trend values at levels of the upper mesosphere [Keckhut et al., 1995]. Certainly, one cannot exclude from consideration the fact that according to Hauchecorne et al. [1991], the observation frequency during 1979-1983 was essentially lower than in the later years. Therefore, the data on temperature variability in the middle atmosphere are probably based on the observations during 1984-1989 [Hauchecorne et al., 1991].
Keckhut et al. [1995] paid close attention to the study of solar activity influence and the Pinatubo eruption on temperature variations of the middle atmosphere. Quite an intriguing result is the tendency revealed of the sign of both correlations in the mesosphere to change from positive to negative at heights H > 65 km. At 80 km, both correlations have negative values. The correlation estimates above 80 km are absent in Keckhut et al. [1995], although the measurement results up to 88 km are shown by She et al. [1995], dedicated to studies of the mesopause thermal regime during 1991-1993.
The use of a sodium lidar made it possible [She et al., 1993, 1995; Yu and She, 1995] to describe with good accuracy the bimodal temperature distribution at heights of 83-103 km, with a local maximum of the annual mean temperature at 91-92 km. Since the increase of T at altitudes 86 and 100 km during 1992-1997 with a maximum in the first part of 1993 is related by She et al. [1998] to the consequences of the Pinatubo eruption, the corresponding evaluation of this effect in the upper mesosphere on the basis of lidar data [Keckhut et al., 1995] contradicts the results of She et al. [1998]. If we consider the She et al. [1998] interpretation as erroneous and relate the temperature increase in the mesopause region to high solar activity during the observational period [Semenov and Shefov, 1997], then the estimates by Keckhut et al. [1995] of the temperature relation to solar activity level during the 11-yr cycle [1] and naturally of the temperature trend above 70 km should be doubted. Thus, interpretation of long-term and episodic temperature variations on the basis of the data on comparatively short temporal series of lidar observations that cover, in the best case, the period between the maxima of the 21st and 22nd solar cycles, during which large volcano eruptions have occurred (El Chichon in April 1982 and Pinatubo in June 1991), presents a rather complicated problem.
The estimates of the linear trends of the monthly temperature of the middle atmosphere (25-75 km) from the rocket-sounding data at high, middle, and low latitudes showed that during 1969-1995, a systematic cooling of the mesosphere occurred in all seasons and at all latitudes. The negative temperature trend of the nontropical mesosphere (up to a height of about 65 km) in the spring-summer period has lower values than in the autumn-winter months and approximately the same value as over the tropical station Tumba in all seasons.
In the stratosphere, in May-September from the data of the Heiss Island and Volgograd stations, and in January-May, from the data of the Molodezhnaya station, the negative temperature trend only slightly changes. Height increases (Heiss Island) or decreases (Molodezhnaya) with an increase in temperature. The trend over the tropical station Tumba increases from 25 to 35-40 km in all seasons and then decreases down to minimum values at heights of 45-50 km. In November-March, from the data of the Heiss Island and Volgograd stations, and in June-November, from the data of the Molodezhnaya station, the negative trends decrease with an increase of height from 25 km. In some month's the trends pass into the region of positive values with maxima from 0.3 to 0.7 K yr -1 at heights of 35-40 km. Under further increase of height from 40-50 km, the trends return into the region of negative values, and their magnitude increases in the mesosphere. Over the Molodezhnaya station above 40-45 km in spring (September-November), the trends become positive again with a maximum in December at 55 km.
Thus, in the autumn-winter calendar period in the middle and upper stratosphere over the Volgograd and Heiss Island stations and in winter-spring calendar period over the Molodezhnaya station during 1969-1995, the linear temperature trends are positive and statistically significant.
We believe that this fact is of great importance since in its main features (vertical interval, season, amplitude, latitudinal location) it agrees well with the theoretical predictions of the climatic variations in the middle atmosphere due to variations of the concentrations of the radiation-active minor gas constituents of the atmosphere [Mahlman et al., 1994; Rind et al., 1990]. The most impressive success of the numerical modelling is reproduction of the vertical location and value of the positive trend because of the ozone layer exhaustion over the Antarctic [Mahlman et al., 1994] and seasonal duration of the upper stratosphere heating with a change of the trend sign in adjacent months of winter under carbon dioxide concentration increase [Rind et al., 1990].
In Mahlman et al. [1994] and Rind et al. [1990], the positive anomalies of the seasonal temperature trends in the middle and upper stratosphere have a regional character: high latitudes of the Northern [Rind et al., 1990] and Southern [Mahlman et al., 1994] Hemispheres. The observation results agree on the whole with the predicted time, vertical location, and values of the positive trends and demonstrate their presence both at high latitudes of both hemispheres and middle latitudes of the Northern Hemisphere. Therefore, one can assume that the variations of the annual temperature behavior in the middle atmosphere (most visually manifested in the occurrence of seasonal positive anomalies on the background of the negative trend in the annual mean temperature of the middle and upper stratosphere) are a consequence of global changes of the atmospheric chemical composition and initiated by them variations in radiation and dynamical processes. That is exactly what follows from the numerical modelling results [Mahlman et al., 1994; Rind et al., 1990; Rosenfield et al., 1988; Schwarzkopf and Fels, 1985; Shine, 1987].
Gadsden, M., A secular change in noctilucent cloud occurrence, J. Atmos. Terr. Phys., 52 (4), 247, 1990.
Hauchecorne, A., M.-L. Chanin, and P. Keckhut, Climatology and trends of the middle atmospheric temperature (33-87 km) as seen by Rayleigh lidar over the South of France, J. Geophys. Res., 96, 15,297, 1991.
Hernandez, G., Lower-thermosphere temperatures determined from the line profiles of the OI 17.924-K (5577 Å) emission in the night sky, 1, Long-term behavior, J. Geophys. Res., 81, 5165, 1976.
Keckhut, P., and K. Kodera, Long-term changes of the upper stratosphere as found by Japanese rocketsondes at Ryori (39o N, 141o E), Ann. Geophys., 17, 1210, 1999.
Keckhut, P., A. Hauchecorne, and M.-L. Chanin, Midlatitude long-term variability of the middle atmosphere: Trends and cyclic and episodic changes, J. Geophys. Res., 100, 18,887, 1995.
Kokin, G. A., and E. V. Lysenko, On temperature trends of the atmosphere from rocket and radiosonde data, J. Atmos. Terr. Phys., 56 (9), 1035, 1994.
Kokin, G. A., E. V. Lysenko, and S. Kh. Rozenfeld, Temperature variations in the stratosphere and mesosphere during 1964-1988 from the rocket sounding data, Izv. Akad. Nauk SSSR Fiz. Atmos. Okeana (in Russian), 26 (7), 702, 1990.
Lysenko, E. V., S. Kh. Rozenfeld, and K. E. Speranskiy, Experimental determination of accuracy characteristics of rocket meteorological measurements, Meteorol. Gidrol., 10, 46, 1982.
Lysenko, E. V., G. G. Nelidova, and A. M. Prostova, Thermal regime variations in the stratosphere and mesosphere during recent 30-years, I, Evolution of the temperature trend, Izv. Akad. Nauk Ross. Fiz. Atmos. Okeana (in Russian), 33 (2), 241, 1997a.
Lysenko, E. V., G. G. Nelidova, and A. M. Prostova, Thermal regime variations in the stratosphere and mesosphere during recent 30-years, II, Evolution of the annual and semi-annual temperature variations, Izv. Akad. Nauk Ross. Fiz. Atmos. Okeana (in Russian), 33 (2), 250, 1997b.
Mahlman, J. D., J. P. Pinto, and L. J. Umscheid, Transport, radiative, and dynamical effects of the Antarctic ozone hole: A GFDL "SKYHI" model experiment, J. Atmos. Sci., 51 (4), 489, 1994.
Rind, D., R. Suozzo, N. K. Balachandran, and M. J. Pratcher, Climate changes and the middle atmosphere, Part 1, The doubled CO 2 climate, J. Atmos. Sci., 47 (4), 475, 1990.
Rosenfield, J. E., M. R. Schoeberl, and P. A. Newman, Antarctic spring-time ozone depletion computed from temperature observations, J. Geophys. Res., 93, 3833, 1988.
Rozenfeld, S. Kh., Analysis of the regular components of observation series given at irregular sequence of points, Meteorol. Gidrol. (in Russian), 3, 3, 1986.
Schwarzkopf, M. D., and S. B. Fels, Improvements to the algorithm for computing CO 2 transmissivities and cooling rates, J. Geophys. Res., 90, 10,541, 1985.
Semenov, A. I., Temperature regime of the lower thermosphere from the emission measurements during the recent decades, Geomagn. Aeron. (in Russian), 36 (5), 90, 1996.
Semenov, A. I., and N. N. Shefov, Empirical model of variations in the atomic oxygen 557.7-nm emission at night, 2, Temperature, Geomagn. Aeron. (in Russian), 37 (3), 143, 1997.
She, C. Y., J. R. Yu, and H. Chen, Observed thermal structure of a midlatitude mesopause, Geophys. Res. Lett., 20 (7), 567, 1993.
She, C. Y., J. R. Yu, D. A. Krueger, R. Roble, P. Keckhut, A. Hauchecorne, and M.-L. Chanin, Vertical structure of the midlatitude temperature from stratosphere to mesopause (30-105 km), Geophys. Res. Lett., 22 (4), 377, 1995.
She, C. Y., S. W. Thiel, and D. A. Krueger, Observed episodic warming at 86 and 100 km between 1990 and 1997: Effects of Mount Pinatubo eruption, Geophys. Res. Lett., 25 (4), 497, 1998.
Shine, K. P., The middle atmosphere in the absence of dynamical heat fluxes, Q.J.R. Meteorol. Soc., 113, 603, 1987.
Taubenheim, J., G. Entzian, and K. Berendorf, Long-term decrease of mesospheric temperature, 1963-1995, inferred from radio wave reflection heights, Adv. Space Res., 20 (11), 2059, 1997.
WMO, Global Ozone Research and Monitoring Project, Rep. 18, Report of the International Ozone Trends Panel, Vol. 2, pp. 486-487, World Meteorological Organization, Geneva, Switzerland, 1988.
Yu, J. R., and C. Y. She, Climatology of a midlatitude mesopause region observed by a lidar at Fort Collins, Colorado (40.6o N, 105o W), J. Geophys. Res., 100, 7441, 1995.