A. R. Polyakov and A. S. Potapov
Institute of Solar-Terrestrial Physics, Irkutsk, Russia
 0.2 Hz. Most likely
the nature of this resonating structure
relates to the ionosphere. It is also shown that
within the framework of the adopted approach
the second harmonic of the carrier frequency
of Pc1 observed on the
ground is caused by the second harmonic of magnetospheric radiation
acting on the resonator and is not the consequence of the nonlinearity
of the regime of forced oscillations.
0.2 Hz. Most likely
the nature of this resonating structure
relates to the ionosphere. It is also shown that
within the framework of the adopted approach
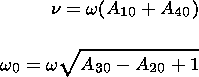
the second harmonic of the carrier frequency
of Pc1 observed on the
ground is caused by the second harmonic of magnetospheric radiation
acting on the resonator and is not the consequence of the nonlinearity
of the regime of forced oscillations.
Wave and hydromagnetic diagnostics of the near-Earth plasma requires special methods to obtain information about the whole system, including parameters of the medium, basing on results of measurements made at some local site. There is no universal technique to achieve this goal. Different approaches are used depending upon the kind of oscillation, its source, and the structure of system. They include spectral analysis, the method of the analytical signal, study of dynamic spectra, examination of the dispersion, i.e. the frequency dependence of the arrival time of the signal, etc. By means of various tricks, these procedures provide individual characteristics of some parts of the system.
Here we present what is termed the technique of statistical modeling which is able to give information on general properties of an oscillating system, making it possible to build a mathematical model describing the dynamics of the system. Besides, this method provides a means of calculating, based on in-situ experimental measurements, some physical characteristics of the system, such as its eigenfrequencies and rate of decay. The technique suggested is based on analyzing the amplitude and phase fluctuations. Correlation functions of these fluctuations depend to a large measure on the properties of the subject under study thus providing the starting point for constructing a mathematical model of the object by solving an inverse problem. (However, we must note here that our technique does not follow the classic inverse theory quite strictly. Therefore, in this paper the term "inverse problem'' has conventional meaning.) This approach was first proposed by Gudzenko [1962] and has been successfully used to study solar activity cycles [Gudzenko and Chertoprud, 1964]. In geophysics, it was used to investigate Pc4 [Guglielmi et al., 1983] and Pc3 [Polyakov and Potapov, 1989; Polyakov et al., 1992] continuous geomagnetic pulsations. It is known that Pc3 pulsations are forced oscillations of geomagnetic field shells. Therefore, to describe them, a model of a damped oscillator excited under the action of an external periodic force might be best suited for this purpose. Polyakov and Potapov [1989] and Polyakov et al. [1992] used the above model, and this allowed them to put forward a way to estimate such key parameters for diagnosing the magnetosphere as the damping coefficient and the oscillation eigenfrequency of various magnetic shells.
In this paper we give a description of a special technique for analyzing the oscillations (section 2), describe in details the procedure for solving an inverse problem (section 3), build a dynamic model of oscillations with taking into account the second harmonic of the carrying frequency (section 4), apply the statistical modeling technique to the analysis of Pc1 geomagnetic pulsation (section 5), and, in closing, discuss the results obtained (section 6).
Gudzenko [1962] developed the algorithm for solving an inverse problem of statistical theory of oscillations. Being one of the ways to handle time series of continuous periodic processes, this algorithm makes it possible to reveal the properties and to determine quantitative characteristics of a model of the subject which gives rise to the oscillations. In the proposed method it plays the same role as Fourier-transform in spectral methods. Hence there is a need to consider its main concepts.
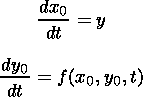
Any periodic oscillatory process with one degree of freedom x0(t) may be considered to be the solution of a set of ordinary differential equations of a general form:
| (1) |
Here f(x0,y0,t) is an arbitrary function only limited by the condition of x0(t) periodicity. The form of the dependence of this function upon variables determines the kind of oscillations: free, forced, etc.
Geomagnetic pulsations (ULF emissions), like most natural oscillatory processes, are not strictly periodic. Even within an ideal fragment of Pc type pulsations random changes of amplitude and phase inevitably occur. To take this into account, we add to the right-hand side of (1) a random function F(t). This can be done providing the amplitude and phase fluctuations are not large, i.e. F(t) does not heavily distort the output signal:
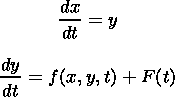 | (2) |
Usually, a so-called Langeven source is used as a
F(t), i.e. a
random process, an auto-correlation function for which has the form of
F(t)F(t+t)=2Dd(t), where
d(t) is a
delta-function, and
D is the intensity of a random effect on the
system. The technique proposed here does not require such a strong
limitation. A sufficient condition is
tF
The model system of stochastic differential equations (2) forms the basis
of the algorithm for solving an inverse problem. The procedures of this
algorithm are all intended for determining the form of the dependence of a
deterministic function
f(x,y,t) upon its arguments. In doing so, a
finite fragment of the measured signal
x(t) is used as initial data,
and scarcely any a priori information about the function
f is
invoked.
where
n and
w0 are the damping coefficient and
the
eigenfrequency of the oscillator,
respectively;
A,
w, and
j are the amplitude, the frequency, and
the initial phase of a periodic
external force,
respectively. The amplitude and phase of the solution contain
fluctuations caused by the action of a random force
F(t). In
statistical radio physics, such a signal refers to periodic
non-stationary random processes. For them, an extension of the
ergodicity theorem
[Gudzenko, 1961]
is true.
According to this
theorem, an average (over the probability) oscillation is defined as
an average of all separate oscillations which are present in the
chosen time interval. We will designate an average over an ensemble of
oscillations by the angle brackets. To define
Let us now use a local system of coordinates related to MPT.
We take at
an arbitrary instant of time a point
A on the phase track (see Figure 1b).
For each of such points it is possible to determine uniquely the nearest
point
M at MPT. Let an interval
AM be normal coordinate
n in the
local system,
n=
A
random action
F(t) in the system (2) leads to a deviation of phase
tracks from MPT, therefore the following conditions must be true for
them
where
g is a random value coinciding with the tangential
deviation of the point
A from MPT. Normal and tangential deviations
have a simple physical meaning. They determine the amplitude and phase
fluctuations, respectively, of the signal of unit frequency measured
at the output of the system (2). The tangential coordinate
q is the phase of the mean or non-disturbed oscillation,
and
t is the
signal phase with taking into account the action by a random force
F(t).
The local coordinates
n and
q completely describe
the position of the point represented on the phase portrait of the
oscillation providing the MPT is defined. Therefore in the set of
equations (2) we can pass from the coordinates
x and
y to
n and
g , and oscillation phase
t change to phase of MPT. To do
this, we will use relations which follow from the sketch presented in
Figure 1b:
where
a is the angle between a normal to MPT and the
axis
OY. On substituting equation (5) into equation (2)
by taking into account equation (4), we
obtain a set of equations which are linear with respect to the small
values of
n and
g
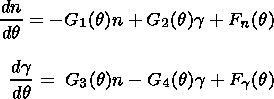
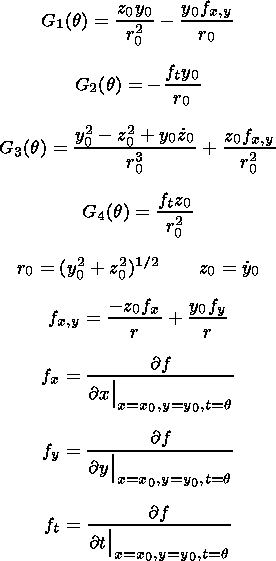
Here
Gi(q) are so-called dynamic
coefficients (DC) which are defined
by
The dot
above a symbol means a derivative over
q.
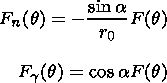
Fn and
F<FONT FACE='Symbol'>g are
normal and tangential components of a random action,
respectively,
It follows from
equation (8) that DC are combinations of
periodic functions. So they must also be periodic with the mean period
of oscillations.
Simultaneous equations (6) represent a pair of
nonhomogeneous linear differential first-order equations. Their
solution can be written down in a general form using the concept of
the transfer function
H(q,t):
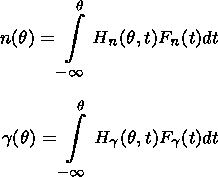
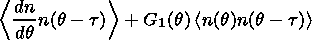
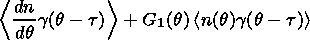
Let us consider the first equation of the system (6).
Let us multiply
it successively by
n(q -t )
and
g (q - t ).
After performing the procedure of averaging over an ensemble of phase
cycles, we will have
Using the fact
that the correlation time
tF of the random function
F is limited by the period, it is not difficult
to show that the right-hand sides of the above equalities are zero providing
t >tF.
To do this, the relation (9) for
n is substituted
into the right-hand side of the first of the equalities (10). Taking
into account (8), we obtain
We consider a random
process
F(t) to be a stationary process with a
limited correlation time. This means that the correlation function
under the integral depends only on the difference
q -t and can
be presented as
Since
t changes
with integration from
-
If one applies the same procedure to the second
equation of (6), then a set of four algebraic equations will result in
which the dynamic coefficients
Gi, i=1,2,3,4 are considered to be
the unknown terms. By solving this set of equations, one gets formulas
to determine the DC phase dependencies:
It is necessary
to note that
Gip can be uniquely determined using
the known fluctuations of the amplitude, phase, and their derivatives
over the phase for an arbitrary value of
t . If we find
tF in any way, then we can determine
the phase
dependencies of DC which contains information about the form of
dependence of the function
f(x,y,t) on its arguments.
The relations (11), along with the method of building MPT, are the
basis for solving an inverse problem. The procedure of solving can be
divided into several steps.
A fragment of the measured signal is chosen in
such a way that the first and the last values both correspond to
oscillation minima. Each of the values of the initial signal
x(t) is
normalized to the amplitude averaged over the fragment, and time
t is measured in units of the mean period corresponding to the carrier
frequency. After that, for every value of
x(t), the value of
y(t)=dx/dt is calculated.
The tracks of all oscillations
are plotted in the coordinate plane
x,y. After that, the mean track
is plotted by the method of successive approximations, and the local
coordinate values of
n and
q are assigned to each of track
points. The units of phase
q measurement are radians, and
n is a dimensionless quantity. Using formula (4) the tangential
deviations are calculated. It is worth noting that MPT represents a
parametric sequence of points
(x0,y0). Thus it is easy to find the
analytical form of the phase dependence of
x0 as soon as the main
track has been found in a graphic way.
Correlation functions are calculated from the relations (11) for the
main values of the phase
q using the known values of
n and
g . The angle brackets designate an average over
an ensemble of
oscillations. So every correlator is defined as an average of those
values of the quantity between the brackets that have a phase which
differs from the main value by
2kp, where
k is an integer.
Formulae (11) can be only used when
t >tF.
The upper boundary for
tF is the mean period,
the lower boundary can be determined only by invoking additional
information on the origin of oscillations. In the case of lack of such
information every value of DC should be calculated for several different
t , whereupon the average should be found in order
to reduce the
errors of DC evaluation. It should be noted that calculations of both
the mean oscillation and DC are the more accurate, the greater number
of oscillations is contained in the initial fragment of the signal.
If this number is not very large (10-15), then the phase dependencies
x0(q ) and
Gi(q ) can differ
substantially from the
true ones.
These functions are found
only for the main values of the phase, so they should be considered
periodic. The frequency of the main mode, in view of the
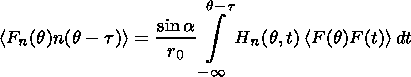
normalization, is unity. Since any periodic function can be
represented as the sum of Fourier series, the following relations are
true for the phase dependencies of
x0 and
Gi:
Here
j is the harmonic number equal to its frequency,
i is the DC index, and
N is the total number of harmonics.
Amplitudes of the mean oscillation
aj,
bj are found when building
MPT. The coefficients
Aij,
Bij can be calculated from the known dependencies
Gi(q) by the method of
least squares.
Thus the final product of the procedure of solving the inverse
problem includes two groups of parameters,
(aj,bj) and
(Aij,Bij). The parameters of the
first and second groups,
respectively, characterize the mean oscillation and the deviation of
actual oscillations from the mean. Consequently, no predetermined
functional connection can exist between them, as it is impossible to
indicate a universal procedure of calculating
Aij,Bij from the
known
aj,bj, and vice versa. No such
connection exists also
between individual parameters inside each group. On the other hand,
they must all depend, by definition, on the form of one function
f(x,y,t). If it becomes clear after an independent calculation
that
some of them can be expressed in terms of others, then a study of
these relationships must reveal the structure of the dependence of the
function
f on its argument.
Proceeding further along the path of solving the inverse problem, we
seek to find the method of determining
f(x,y,t) from the known
aj,bj,Aij,Bij.
To do this, we consider the case of forced
oscillations as an example. The system (2), (3) should be considered
to be the initial equations describing these oscillations. Upon
substituting (3) into (7), we determine the form of the phase
dependencies of the DCs
By comparing (12) and (13),
it is easy to check that the output
parameters of the inverse problem for forced oscillations are related
by the following relations:
The MPT, in view of
the normalization, will have the form of a circle
of unit radius. Hence the output parameters of the mean oscillation
may be represented as
Thus, if
the output parameters of the inverse problem for the
oscillatory process satisfy the conditions (14), then they will be
forced oscillations, and the dynamics of the process must be described
by the system of equations (2), (3). Using such an approach, it was
shown in
[Polyakov and Potapov, 1989]
that geomagnetic pulsations Pc3 refer to this type of
oscillations. This conclusion could be considered trivial, if, along
with it, there were no possibility of experimentally determining such
parameters of the oscillator as the damping coefficient
n and the
eigenfrequency
w0. Formulas by which these parameters
are
calculated, are the consequence of the conditions (14) and have the
form
Consider now the case of weakly nonlinear forced oscillations. Assume
that the right-hand side of (3) additionally contains small (in value)
nonlinear second-order terms
c1x2,c2y2,c3xy.
The MPT in this
case does not have the form of an ideal circle, because the phase
dependence of the mean oscillation contains a small (in amplitude)
second harmonic
a2 0,
b2 0. By making use of the
relations (7), it is possible to demonstrate that in the phase
dependencies
G1(q ) and
G3(q ) (13) there appear
terms
corresponding to the fundamental and third harmonics. As a result, the
conditions (14) are supplemented by the relations
It should be
noticed that
c1,c2,c3 are dimensionless
quantities,
because the arguments of the function
f(x,y,t) are considered
normalized to the mean amplitude and to the mean period. It has
been pointed out above that the accuracy of determining the
output parameters of the inverse problem depends on the number
of oscillation periods containing in the sample. Therefore, we
verified the resulting conditions not through a simple comparison
of the output parameters but using
statistical methods of verifying hypotheses. Fulfillment of the
conditions serves as the proof that the relation for the function
f(x,y,t) involves nonlinear terms. By calculating the
coefficients
c1,c2,c3 from the output parameters,
we thereby determine the
form of each of them.
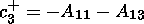
Harmonics in forced oscillations can appear not only due to nonlinear
terms in equations (2), (3). A similar result ensues from the presence
of small oscillations in the driving force which have a frequency
multiple to the carrier frequency. However, if we are dealing with the
second harmonic of the driving force, then the additional fundamental
and third harmonics in the phase dependencies (13) appear in another
pair of coefficients
G2(q ), G4(q ). By analyzing the
relationships between output parameters of these harmonics, we can
either
accept or discard a hypothesis of presence of oscillations with double
frequencies in the source, as well as determine the numerical values
of the characteristics of these oscillations. In this way, using the
proposed method of analysis, it is possible to exactly indicate the
cause of the appearance of harmonics in the oscillations under
investigation.
The oscillations that contain the third harmonic are investigated
according to the same scheme. The difference from the preceding case
only implies that the phase dependencies of the DCs (13) are
supplemented not by the fundamental and third harmonics, but by the
second and fourth harmonics. Such a result suggests an important
generalizing conclusion. The terms of a different power index in the
arguments
x and
y involved in the expression for the function
f(x,y,t) contribute to different harmonics of phase
dependencies of
dynamic coefficients. For that reason, by analyzing the harmonic
composition of the DCs, we can determine the form of all terms in the
function
f and calculate the values of dimensionless coefficients
involved in each of them. This permits us to achieve the final goal of
the proposed method: to construct, from observed oscillations, a
system of equations, the solution of which is provided by these
oscillations themselves.
We now consider in greater detail the situation where the presence of
the second harmonic in the oscillations under investigation is caused
simultaneously by the two factors indicated above. In this case, for
the function
f(x,y,t), in view of the normalization at the first
stage of the solution of the inverse problem, we have, instead of (3),
The nonlinear contribution to this
function is determined by three
dimensionless coefficients
c1,c2,c3, and the second harmonic
of
the source is characterized by the amplitude
d and by the initial
phase
2j . The mean solution
x0 of the system of equations
(2), (16) can be found by the method of successive approximations by
assuming that the above parameters are small in magnitude. Relations
for the coefficients of the Fourier series (12) to a first
approximation have the form
Upon substituting
x0(q ) into (7), in view
of (16), we obtain
formulas for the phase dependencies of the DC
Gi(q ). Since
these dependencies are defined by harmonic functions, it is an easy
matter to obtain from them the relations for the output parameters
of
the inverse problem
Aij,Bij. To a linear (in the small
parameters
c1,c2,c3,d ) approximation,
they are conveniently
represented as the Table 1.
Examination of
Table 1
shows that the output parameters with the
harmonic numbers
j = 0,2 are related by the same relations as in
(14). This means that these harmonics of the DCs are defined solely by
the linear part of the function (16) and by the main mode of the
source. At the same time, nonlinear terms and the second harmonic of
the source make a contribution to the fundamental and third harmonics
of the DCs. Furthermore, in the DCs with the numbers
i = 2, 4, as is
evident from the table, the fundamental and third harmonics are caused
by the presence or absence of the double frequency in the source
spectrum.
The resulting relations can be taken as the basis for continuing
the
solution of the inverse problem. Indeed, the final product of the
procedure of processing the initial signal, as shown above, is
represented by the parameters
Aij and
Bij. Using them, as
well as the formulas from Table 1, it is easy to determine the
coefficients of the function (16). In such a case, the output
parameters of the inverse problem can be considered to be the
parameters
a,b,c1,c2,c3,d,j characterizing the
form of a function which mathematically describes, together with the
system (2), the deterministic behavior of the object that generates
oscillations. It is worthwhile to note an important (in our view)
property of this stage of the inverse problem. It follows from the
formulas of Table 1
that each desired parameter can be expressed
simultaneously in terms of different
Aij,Bij which are
calculated in the procedures of the inverse problem independently from
each other. This makes it possible not only to calculate the values of
the parameters but also to establish the fact of presence or absence
of some or other term in the function (16). Let us consider an example
of the output parameters
a and
b . To each of them we
put in correspondence two parameters such that one of them is
determined from dynamic coefficients with the numbers
i = 1,3, and
the other from the DCs with
i = 2,4
Through a simple substitution it is easy to check
that if
Aij,Bij are defined by the formulas
from Table 1
which
depend only on the form of the function
f(x,y,t), then the
parameters in the chosen pairs coincide. This suggests an important
(for the inverse problem) conclusion: the coincidence of the
parameters in the pairs is a necessary indication that the linear
dependence on the arguments of
f(x,y,t) is the same as in (16) and
that the inhomogeneity of the function is caused by the harmonic
source. To put it a different way, the oscillations under
investigation should be referred to the type of forced oscillations of
the attenuating oscillator. In order for this indication to be, in
addition to necessary, also sufficient, one should prove that for the
other types of oscillations the parameters in the pair of (17) must
not coincide. Consider free oscillations and self-oscillations. They
are characterized by the homogeneity of the unperturbed system of
equations (1). This means that the function
f does not depend on
time explicitly, and its partial derivative
ft is zero. Taking into
account this factor in the relations (7), it is easy to check that the
dynamic coefficients
G2 and
G4 identically equal to zero. Since
the second parameters in (17) are determined from these DCs, it is
obvious that
a-
For each of the remaining output parameters
c1,
c2,
c3,
d cosj,
d sinj, we arrange in a similar manner each
own pair
For them, as done for (17), we can prove that the coincidence of the
parameters in any one of the pairs can serve as a reliable indication
of the fact that the function (16) involves a term proportional to the
corresponding output parameter. This means that if, for example, the
parameters
c1+, c1- obtained by processing
the oscillatory
process using the procedures of the inverse problem are found to be
identical, then the term
c1x2 must be involved in the function
f(x,y,t) of model equations (2) for these oscillations.
Thus our proposed method provides a means to reconstruct the function
f(x,y,t) from the output signal. However, its practical
implementation involves certain difficulty which should be taken into
consideration. The point here is that, as shown above, the output
parameters
Aij and
Bij are calculated in inverse problem
procedures with a certain uncertainty which increases with a decrease
of the number of oscillations in the output signal interval that is
processed. For regular geomagnetic pulsations, even in the most
favorable stationary regime of generation, it is difficult to detect
the interval containing more than a few tens of oscillations. The
parameters in the pairs of (17), (18) in this case become, to a
certain extent, random quantities, and their simple algebraic
comparison loses its meaning. Rather, it is necessary to use
comparison rules employed for random numbers
[see, e.g.,
Hudson, 1964].
To do so, one should select and process at a time many intervals of
oscillations referring to a single process. This will make it possible
to create a sample of random quantities (17), (18) which can be used
to determine the correlation coefficients
K of the parameters of
each pair. It follows from formulas (17), (18) that whenever the
parameters in a pair must coincide, they are both equal to one of the
output parameters. This means that a linear functional connection
occurs between them. The correlation coefficient in such a case must
assume values close to unity. And, on the contrary, if the numbers in
a pair are defined by different formulas, then a change of one of them
is in no way associated with a change of the other. Consequently, no
functional connection exists between them, and the correlation
coefficient must be zero. Thus large values of
K can be chosen as
one of the criteria of coincidence of the parameters in the pair. We
now introduce a generalized designation
a and
b for the numbers in
the pair. If input information for the solution of the inverse problem
is provided by a limited, selective interval of the oscillatory
process, then each of them can be represented as the sum of the
determined and random terms
a=d+ a,
b=d+ b, where
d is
a general designation of the corresponding output parameters, and
a and
b are statistically independent random
numbers. It is obvious that if
d = 0, then for such a pair
K = 0.
If the situation is the reverse, i.e. when
a= b=0, we
have
K = 1. This means that if the error of determining the
parameters of the pair by far exceeds the value of the output
parameter corresponding to this pair, then the correlation coefficient
between them can be not very high even in the case where determined
terms in each of them are identical. Therefore, as one further
criterion, we chose the quantity
T characterizing the ratio of the
parameters of the pair which is determined by the formula
T = 2ab/(a2 + b2). It is easy to
understand that in the case of a statistical
coincidence of
a and
b the distribution of
T must have a maximum
when
T = 1. Thus, if this condition is satisfied and, besides, if
the correlation coefficient has a value close to unity, it can be
stated with confidence that the parameters of the pair of random
numbers are statistically identical.
To conclude section 4, we discuss some details of the proposed
method of fluctuation modeling of oscillatory processes. The relations
(17) give us indications which permit us to determine the cause of the
generation and the dynamics of development of the oscillatory process,
i.e. they determine the type of oscillations. Indeed, if the
parameters in the pairs coincide, then the oscillations should be
considered forced. If, however, no coincidence is observed, then using
the scheme of reasoning described above, one can form similar pairs of
parameters for other types of oscillations (parametrical,
self-oscillations, etc.). Upon determining in which particular pairs
the parameters are identical, we obtain the answer to the question: To
what type do the observed oscillations refer? This, in turn,
establishes automatically the basic, linear structure of the function
f(x,y,t) of model equations (2). As soon as the form
of the function
has been established, it is easy to determine the numerical values of
the coefficients of its terms. Note that these coefficients can not
always be the final goal of the proposed method. Often, especially in
problems of investigating the new properties of geomagnetic
pulsations, the more important issue is to determine the type of
oscillations and the structure of the desired function. As far as the
relations (18) are concerned, they, unlike (17), give indications of
the presence or absence of terms of the function which distort only
slightly the form of the output signal. They can be involved in the
function
f(x,y,t) (and may not be involved) for oscillatory
processes of any type. All depends on whether the parameters of the
corresponding pair of (18) coincide or not.
To test the effectiveness of the method described above, we chose
geomagnetic Pc1 pulsations as the object of study, because records
just of these pulsations can provide favorable material for a
processing. The properties and characteristics of Pc1
are given,
for example, by
Guglielmi and Pokhotelov [1996].
Mention should be made also of
Alpert and Fligel [1985],
who found small spectral multiples to the carrying frequency
in
Pc1 spectrum.
A phase-portrait method was used to investigate a second harmonic of
Pc1 spectrum by Kiselev and Kozlovskii [1989].
By adhering to
this criterion, we selected about 150 intervals of Pc1 pulsations,
each of which contained from 10 to 20 oscillations. A preprocessing
implied digitizing magnetic analog records with the sampling rate of
20 Hz. Subsequently, the numerical set of each interval was processed
sequentially, following all procedures of the method that has been
described in detail in the first part of this paper. As the output
result for each interval of Pc1, we obtained 28 values of the
parameters
Aij, i=1,2,3,4 j=0,1,2,3; Bij,
i=1,2,3,4 j=1,2,3. From
them, using the relations (18) and (19) we formed samples of pairs of
numbers corresponding to the output parameters
a,b,c1,c2,c3,d
cosj,d sinj.
Each sample has the size
equal to the number of processed intervals. Finally, for each pair we
determined the correlation coefficient
K between its parameters, and
the array of values of the quantity
T which, it must be recalled,
characterizes the ratio of the parameters of the pair. In what
follows, in order to distinguish these characteristics for different
pairs, we shall assign to them the lower index of the corresponding
output parameter. These characteristics must permit us to determine in
which pairs the parameters are statistically identical and in which
they are not identical, and on this basis, to draw the conclusion
about the structure of the function
f of governing model equations
(2) for Pc1 pulsations.
The conclusion drawn here means that the second harmonic
of the
carrier frequency involved in Pc1 pulsations, if it exists, must be
caused by the second harmonic in the source. To check that this is the
case, we now consider the results of calculations for the two last
pairs in (18). The distribution of
Tdc, as is evident from
Figure 4d,
has a sufficiently clear maximum around unity, and the
dependence of
dc+ on
dc-, plotted in Figure 4c, is
characterized by the correlation coefficient
Kdc= 0.63. For the
pair corresponding to the output parameter
d sinf , the results
obtained were similar, because the peak of the distribution of
Tdc lies near unity,
Kds= 0.58. Note that not so high (as
one would like) values of the correlation coefficients can be caused,
as shown above, by the small value of the parameter
d, even when the
parameters in the pairs coincide statistically. Refined criteria of
coincidence in this case are represented by peaks in the distributions
of
Tdc and
Tds. Since these distributions have clear maxima
and, besides, the values of
Kdc and
Kds are indeed much
higher than the correlation coefficients of the first three pairs of
(18), we can be confident that the parameters in the pairs under
consideration are statistically identical. This means that the source
of Pc1 pulsations has a small (in amplitude) second harmonic.
The result obtained contradicts to the one presented by
Kiselev and Kozlovskii [1989], who related the
Pc1 second harmonic to wave
propagation in a non-linear medium.
So, in
sections 2-5 it was shown that Pc1 pulsations
can be well described by the model of attenuating oscillator
which is presented by the system of equations (2) and (16)
with
c1=c2=c3=0. At this point,
however, it is necessary to
point out an important factor. Strictly speaking, the model of
oscillator describes the systems with lumped parameters like a
pendulum or an oscillating circuit. In the near-terrestrial
plasma we are concerned mainly with systems having distributed
parameters. For such systems a resonator or waveguide are the
analogues of oscillator. Inasmuch as Pc1 pulsations are generated
and propagated in the magnetosphere and ionosphere they would be
more properly classified as forced oscillations of a
resonator or a waveguide. At the present time
we are developing a model of resonator with
attenuation on which to analyze in detail fluctuation
characteristics of Pc1. First, positive results have
been obtained already. However we are
confident that preliminary conclusions
on the properties of a waveguide or
resonator which forms Pc1 features can
be made just now starting from the oscillator model
(2),(16) and considering the eigenfrequency involved
in the coefficient
b as
just one value from the infinite series of the oscillatory
normal mode frequencies.
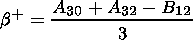
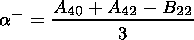
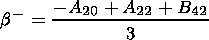
The main conclusions of this study may be summarized as follows:
1. We have suggested a new method for investigating stationary
oscillatory processes based on analyzing amplitude and phase
fluctuations. The method makes it possible to determine (having the
interval of a recording of the oscillatory process as initial
information) the structure of differential equations controlling this
process, as well as the numerical values of coefficients of all terms
involved in them.
2. The possibilities of the method are illustrated by considering
geomagnetic Pc1 pulsations. It is shown experimentally that these
pulsations, when observed on the ground, have properties which are
consistent with that of forced oscillations of some resonating
structure. The frequency of the main normal mode is determined:
f1
3. It has been found that within the framework of the adopted approach
the second harmonic of the carrier frequency of Pc1 observed on the
ground is caused by the second harmonic of magnetospheric emission
acting on the waveguide and is not the consequence of the nonlinear
regime of forced oscillations. Master equations for
these pulsations should be considered to be the system (2), (16), in
which it is necessary to take into consideration that
c1=c2=c3=0.
Alpert, Ia. L., and D. S. Fligel,
On Fourier-analysis of geomagnetic
pulsations Pc1, "two-fold" and "three-fold"
pulsations Pc1 and
fundamental frequencies of the magnetospheric cavity.
I, Planet. Space Sci., 33, 993,
1985.
Demekhov, A. G., V. Yu. Trakhtengerts, and T. Bösinger,
Pc1 waves and ionospheric Alfvén resonator:
Generation or filtration?
Geophys. Res. Lett., 27, 3805,
2000.
Gudzenko, L. I., The generalization of an ergodic system to
nonstationary random processes,
Radiophysics (in Russian), 4, 267, 1961.
Gudzenko, L. I., A statistical method for determining the
characteristics of a noncontrolled self-oscillatory system,
Radiophysics (in Russian), 5, 572, 1962.
Gudzenko, L. I., and V. E. Chertoprud, Some dynamic properties of cyclic
activity of the Sun,
Astron. Zh. XLI(4), 697, 1964.
Guglielmi, A. V. and O. A. Pokhotelov,
Geoelectromagnetic Waves,
Inst. of Phys.,
Philadelphia, Pa.,
1996.
Guglielmi, A. V., B. I. Klain, and A. R. Polyakov, Dynamic parameters of
the self-oscillation model of geomagnetic pulsations,
Geomagn. Aeron. (in Russian), 23, 630, 1983.
Hudson, D.,
Statistics. Lectures on Elementary Statistics and Probability, Geneva, 1964.
Kiselev, B. V., and A. E. Kozlovskii, Quasi-harmonic character of Pc1
geomagnetic pulsations, Geomagn. Aeron. (in Russian), 29, 748,
1989.
Manchester, R. N., Propagation of hydromagnetic emissions in the
ionospheric duct,
Planet. Space Sci., 18, 299,
1970.
Pokhotelov, O. A., V. Khruschev, M. Parrot, S. Senchenkov, and V. P.
Pavlenko, Ionospheric Alfvén resonator
revisited: Feedback
instability,
J. Geophys. Res., 106, 25,813,
2001.
Polyakov, A. R., and A. S. Potapov, Dynamic parameters of geomagnetic
Pc3 pulsations, Geomagn. Aeron. (in Russian), 29, 921, 1989.
Polyakov, A. R., A. S. Potapov, and B. Tsegmed, Experimental estimation
of the resonance frequency and quality of mid-latitude Alfvén
resonators, Geomagn. Aeron. (in Russian), 32, 156, 1992.
Figure 1a gives an example of the solution of
equation (2) for the case
where
f(x,y,t) represents forced oscillations:

Figure 1

(3)  AM, and the minus sign corresponds
to points
located inside MPT. Let the tangential coordinate
q of the
point
A be defined as the length of the sector of MPT from the
initial point
M0 to the
M projection measured in time units. For
definiteness sake, it is assumed that the point
M0 is the point
where MPT intersects the negative ray of the horizontal axis
X.
Equations (1) for the mean phase track in local coordinates
n and
q take the form
AM, and the minus sign corresponds
to points
located inside MPT. Let the tangential coordinate
q of the
point
A be defined as the length of the sector of MPT from the
initial point
M0 to the
M projection measured in time units. For
definiteness sake, it is assumed that the point
M0 is the point
where MPT intersects the negative ray of the horizontal axis
X.
Equations (1) for the mean phase track in local coordinates
n and
q take the form


(4) 
(5) 
(6) 
(7) 
(8) 
(9) 

(10) 


 to
q -t the limits
of the domain of variation of the function argument
< F(q )F(t)> will be
and
t. If
t >tF,
then the integrand is zero with arbitrary
t.
We can prove in the same manner that
< Fn(q )g
(q -t )>=0
with
t >tF.
to
q -t the limits
of the domain of variation of the function argument
< F(q )F(t)> will be
and
t. If
t >tF,
then the integrand is zero with arbitrary
t.
We can prove in the same manner that
< Fn(q )g
(q -t )>=0
with
t >tF.


(11) 


3. Procedure for Solving an Inverse Problem
3.1. Preprocessing
3.2. Constructing the Mean Phase Track
3.3. Searching for the Phase Dependence of Dynamic Coefficients
3.4. Revealing the Harmonic Structure of the Phase Dependence
Functions x0(q ) and Gi(q )
(12) 


(13) 


(14) 


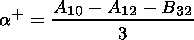
(15) 
4. General Dynamic Model of Oscillations With Provision
for the Second Harmonic
of the Carrier Frequency


(16) 


(17) 
 b- 0.
At the same time the
first parameters depend on the zeroth and second harmonics
G1,G3 which are caused by linear terms in the
function
f(x,y). They must
have the same form as in the case of forced oscillations if
dissipative processes are taken into account, which are inherent in
any natural system. Hence the first parameters in the pairs of (17)
are determined by the formulas from the table and depend on
a and
b . The frequency mismatch
b for the types of
oscillations under consideration is nonzero, because in free
oscillations the carrier frequency differs from the eigenfrequency by
the contribution from the damping factor and in self-oscillations by
nonlinear corrections. Consequently,
a+ 0, b+
0,
which indicates the noncoincidence of the coefficients in the pairs of
(17) for free oscillations and self-oscillations. As far as parametric
oscillations are concerned, the function
f for them is explicitly
time-dependent. However, it follows from the relations (7) that this
dependence does not make any contribution to the zeroth and second
harmonics of the dynamic coefficients
G2,G4. Hence, as in the
preceding case, the parameters in the pairs must not coincide. Thus
the considerations presented above permit us to formulate the final
conclusion: the coincidence of the parameters of the inverse problem
in the pairs of (17) is a necessary and sufficient indication of the
fact that the oscillations under investigation refer to the type of
forced oscillations of an attenuating oscillator.
b- 0.
At the same time the
first parameters depend on the zeroth and second harmonics
G1,G3 which are caused by linear terms in the
function
f(x,y). They must
have the same form as in the case of forced oscillations if
dissipative processes are taken into account, which are inherent in
any natural system. Hence the first parameters in the pairs of (17)
are determined by the formulas from the table and depend on
a and
b . The frequency mismatch
b for the types of
oscillations under consideration is nonzero, because in free
oscillations the carrier frequency differs from the eigenfrequency by
the contribution from the damping factor and in self-oscillations by
nonlinear corrections. Consequently,
a+ 0, b+
0,
which indicates the noncoincidence of the coefficients in the pairs of
(17) for free oscillations and self-oscillations. As far as parametric
oscillations are concerned, the function
f for them is explicitly
time-dependent. However, it follows from the relations (7) that this
dependence does not make any contribution to the zeroth and second
harmonics of the dynamic coefficients
G2,G4. Hence, as in the
preceding case, the parameters in the pairs must not coincide. Thus
the considerations presented above permit us to formulate the final
conclusion: the coincidence of the parameters of the inverse problem
in the pairs of (17) is a necessary and sufficient indication of the
fact that the oscillations under investigation refer to the type of
forced oscillations of an attenuating oscillator.

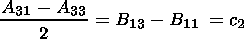
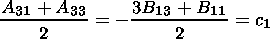
(18) 
5. Application of a Statistical Modeling Technique
to the
Analysis of Pc1 Geomagnetic Pulsation
When selecting the intervals suitable for a processing, we used
records of the geomagnetic field in the frequency range 0.2-3.0 Hz
from station Batagai, East Siberia, Russia
( F = 57o, L
=191o ).
The selection criteria are rather simple and follow from
the main principle of the method used: pulsations in the interval
selected for the analysis must not contain amplitude and phase slips,
and must include as many oscillations as possible, because
this
determines the accuracy of determining the output parameters of an
inverse problem. Oscillation slip means a small-scale kink at the
phase plane. For Pc1 pulsations their amplitude modulation is the
characteristic feature. However, providing amplitude changes are slow
as compared to the oscillation period this modulation has little or no
effect on the output parameters. An example of such a suitable
interval is illustrated by Figure 2.

Figure 2
We shall analyze the results obtained starting from the parameters
defined by (17). For illustrative purposes, Figures 3a
and 3c plot the mutual
dependencies of the parameters in the pairs. One
can notice that the position of points on both plots indicates a
rather high degree of linear dependence of one parameters on the
other. This is confirmed by the values of the correlation coefficients
K<FONT FACE='Symbol'>b = 0.87
and
K<FONT FACE='Symbol'>a = 0.66.
Besides, the distributions of
T<FONT FACE='Symbol'>b and
T<FONT FACE='Symbol'>a , plotted
in Figures 3b
and 3d,
have clear maxima corresponding to the values of
T<FONT FACE='Symbol'>a=1.0
and
T<FONT FACE='Symbol'>b=1.0.
All this indicates that the parameters in the pairs of
(17) statistically coincide for the sample of Pc1 pulsations under
consideration. Consequently, the necessary and sufficient condition is
thereby satisfied, according to which these pulsations should be
referred to the type of forced oscillations of an attenuating
oscillator.

Figure 3
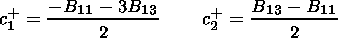
Let us consider the results of calculations for the pairs
of (18)
which are responsible for the presence or absence of nonlinear terms
in the function
f. Since the parameters of these pairs are found to
have similar properties, we use only one of them in the analysis.
Figure 4a
plots
c1+ versus
c1-. This dependence
represents an ensemble of uniformly arranged points which does not
have any well-defined direction. The correlation coefficient for this
pair
K c1 = 0.13. For the other pairs, it has also
small (in
magnitude) values
Kc2=- 0.11 and
Kc3= 0.25.
The distribution of
Tc1, plotted in Figure 4b,
is almost uniform and does not have a clear maximum at all.
This means that the parameters in the pairs under consideration do not
coincide statistically and are independent random quantities caused by the
error in calculating the output parameters of the inverse problem.
Consequently, nonlinear terms in the function
f are absent in the
system of governing equations (2) for Pc1 pulsations.

Figure 4
6. Discussion of Results
Let us try to find out what frequencies of normal modes are
specific to a resonant structure that imprints on fluctuation
properties of Pc1 oscillations. To do this, using the
relations (15) we calculated the values of
w0 for all
intervals of the sample.
Results are
presented in Figure 5b in the form of a histogram of the
distribution. For comparison, Figure 5a plots the distribution of
observed frequencies
w . Note that when selecting the intervals,
their frequency was in no way specially checked upon. As
may be seen from the figure, the frequency values broke up
into two
groups: high-frequency, and low-frequency. It can be noticed, however,
that relative changes of the number of cases for different frequencies
are small, i.e. the distribution in groups, especially in the
low-frequency one, can be considered uniform. In the
w0 distribution, however, three equally
spaced peaks are evident. This
can mean that the peaks correspond to normal modes of the required
resonator or waveguide, and the interval between neighboring
frequencies
Df is about 0.2 Hz.
Let us assume that
the spectrum of normal mode frequencies is equidistant,
fn = n f1.
If so, a relation
df = fn+1 - fn
= f1 is bound to
hold for all harmonic numbers
n. Then we can make an estimate of
the main mode frequency of the
resonator or waveguide (its fundamental frequency):
f1=Df

Figure 5
0.2 Hz. Such a value
is obviously too high for the first harmonic frequency of the magnetic
shell which can be considered as the resonator for ion cyclotron
waves
[see Alpert and Fligel, 1985].
At
the same time it is in good agreement with the cut-off frequency of
ionospheric waveguide. It is unlikely that the obtained fundamental
frequency can be connected with the classical waveguide formed by
F2 layer of the ionosphere
[Manchester, 1970]
because it is a refractive waveguide, it can not hold waves
propagating at normal angle to its axis. So it has a cut-off
frequency, but has not a fundamental one. However, the literature
contains examples of other resonant structures in the ionosphere
like the ionospheric Alfvén resonator
[Demekhov et al., 2000,
Pokhotelov et al., 2001],
which can execute forced oscillations recorded as Pc1.
7. Conclusion
0.2 Hz. Most likely
the nature of this resonating structure
relates to the ionosphere.
Acknowledgments
We are grateful to A. V. Guglielmi for interest to the
work and useful comments. This work was done with financial support
from the Russian Foundation for Basic Research (grant 00-05-64545)
and INTAS Foundation (grant INTAS-01-0013).
References
Load files for printing and local use.
This document was generated by TeXWeb
(Win32, v.1.3) on August 8, 2003.