 40o and shifted southward
by
30o from its initial position
such that the cloud axis became located
below the ecliptic plane. There is no such difficulty in the
alternate model of cloud generation on HCS
[Ivanov and Romashets, 1999].
40o and shifted southward
by
30o from its initial position
such that the cloud axis became located
below the ecliptic plane. There is no such difficulty in the
alternate model of cloud generation on HCS
[Ivanov and Romashets, 1999].
K. G. Ivanov, 1 A. V. Belov, 1 A. F. Kharshiladze, 1 E. P. Romashets, 1 V. Bothmer, 2 P. J. Cargill, 3 and I. S. Veselovskiy 4
1 Institute of Terrestrial Magnetism, Ionosphere, and
Radio Wave Propagation, Troitsk, Russia
2 Max-Plank Institut fur Aeronomie, Katlenburg-Lindau, Germany
3 The Blackett Laboratory, Imperial College of Science, Technology,
and Medicine, London, UK
4 Institute of Nuclear Physics, Moscow State University, Russia
There are arguments in the solar-terrestrial physics in favor of the statement that many interplanetary MHD disturbances are generated by complicated solar sources, the latter being various combinations of coronal holes, filaments, flares, and active regions [Bravo et al., 1998; Burlaga et al., 1987; Crooker and McAlister, 1997; Dryer and Smith, 1987; Gonzalez et al., 1996; Gosling, 1993; Ivanov, 1996, 1998; Kahler, 1991; Mogilevsky et al., 1997]. In the complicated source concept, very perspective in our opinion is its representation as a large unstable configuration of the solar magnetoplasma in which coronal holes, filaments, and active regions are closely interrelated and are only specific components of this source (complex), characterizing its formation, destabilization, and decay [Gosling, 1993; Mogilevsky et al., 1997].
There are two fundamental problems concerning the phenomenology of such complexes: first, study of their dynamics at characteristic times of the order of a few solar rotations, and second, studies of the interactions between its components, especially at the source destabilization phase leading to complicated interplanetary disturbances.
It has been shown recently that the activity complexes appear (disappear) in mutual collisions (reflections) of photospheric regions of the open magnetic field of the Sun [Ivanov and Kharshiladze, 2002; Ivanov et al., 2001b]. As a result, we propose to use the dynamics of open regions as a convenient instrument for determination in advance of the tendencies leading to formation and destabilization of activity complexes including such determinations into the analysis of some prominent events of the solar-terrestrial physics. The analysis of the well-known disturbances of 5-11 January 1997 [Ivanov et al., 2001a; Ivanov et al., Slow dynamics of photospheric regions of open solar magnetic field, solar activity, substructure of the interplanetary space and near-Earth disturbances of the early 23rd solar cycle: 1. December 1996 to February 1997 events, submitted to International Journal of Geomagnetism and Aeronomy, 2002, (hereinafter referred to as Ivanov et al., submitted manuscript, 2002)] is an example of such an approach. The above papers demonstrated that there was observed a convergence of open photospheric regions at least one rotation prior to the activity complex destabilization, that the filament-active region and coronal hole were the most active components of this complex, and that taking into account of the interaction between them is important for explanation of the main characteristics and some peculiarities in the configuration, structure and dynamics of the interplanetary disturbance observed near the Earth. At the same time, the set of these characteristics and features is an experimental requirement which makes it possible to indicate perspective approaches to the MHD modeling of this disturbance.
Similar approach is used below to consider in detail the 12-18 May 1997 event. This event is interesting in particular due to the fact that in this event for the first time the Morton wave was registered in the extreme ultraviolet [Thompson et al., 1998], a coronal halo was observed [Plunkett et al., 1998; Sheeley et al., 1999; Webb et al., 2000a], a pair of transient coronal holes (dimmings) located symmetrically relative the neutral line of the active region magnetic field was formed [Hudson et al., 1998; Thompson et al., 1998], preflare sigmoid shape of the coronal arcs was observed [Glover et al., 2000; Hudson et al., 1998], the photospheric bases of the post-eruptive arc coincided almost exactly with the magnetic spots of the opposite polarity [Thompson et al., 1998; Webb et al., 2000a], small rapid (during the flare) and considerable slow (of about a day) variations of the magnetic flux in the active region were registered [Lara et al., 2000], and the most intense magnetic storm of 1997 was observed [Bruckner et al., 1998; Ivanov and Romashets, 1998]. Considering the data of the Wind/Waves radiophysical experiment, Gopalswamy et al. [[2000] referred to this event as to a radio-rich event because there presented in it not only the meter and kilometer, but also type II decameter and hectometer radiobursts.
Considering the data of this event, Gibson and Low [[2000] proposed a model of the initial instability of the magnetoplasma configuration of the compact spheroid (spheromac) type. Considerable attention has been paid also to the near-Earth interplanetary disturbance: to the cloud modeling [Ivanov and Romashets, 1999; Watari et al., 2001; Webb et al., 2000a, 2000b], to variations of the solar energetic particles [Cane et al., 1998; Lario et al., 2000; Makela et al., 1998; Mazur et al., 1998; Sanderson et al., 1998; Torsti et al., 1998] and two-direction superthermal electron fluxes [Shodhan et al., 2000]. Attention has been also drawn to the three-phase dynamics of the near-Earth disturbance (especially to the MHD structure of its preliminary (precursor) phase [Ivanov and Petrov, 1999; Ivanov et al., 1999]) and to the ground-based variations of the galactic cosmic rays [Munakata et al., 2000].
It is desirable to continue the studies of this event in the following directions:
First, on analogy with the 5-11 January 1997 event [Ivanov et al., 2001a; Ivanov et al., submitted manuscript, 2002] the slow (from one rotation to another) dynamics of the photospheric regions of the open field, solar activity complexes and interplanetary medium structure should be taken into account.
Second, pay attention to the fact that almost in all papers cited above the interpretation and modeling of the near-Earth disturbance is based on the consideration of only those solar events which had been formed in AR 8038 after the 1n(C.1.3) flare near the central meridian. The fact that these events could have been altered in interactions in the activity complex was never taken into account. Relating to this, we would note that the event have occurred in the vicinity of the heliospheric current sheet (HCS) [Ivanov and Romashets, 1999; Sanderson et al., 1998] and that between the active region and HCS an active ( L = 12o ) and dense ( I = 2 ) active filament of the ADF type was observed (Solar-Geophysical Data, Boulder, NN 637-640, 1998). Therefore, on the propagation path of the coronal mass ejection (CME) from the Sun to the Earth an interaction of CME with ADF and HCS should have occurred. Thus it is interesting to bear in mind that though the kilometer radiobursts of the type II were observed by the Wind satellite almost permanently till the arrival of the forward shock wave to the Earth (http://lep694.gsfc.nasa.gov/waves), their intensity was very small [Reiner et al., 1998], especially till about 1800 UT on 13 May. The latter fact makes it possible to assume that they were screened by the plasma sheet on HCS [Ivanov and Romashets, 2001]. Thus the presence of the activity complex (AR + ADF + HCS) and the above-indicated interactions could be manifested in the structure and dynamics of the near-Earth disturbance, in particular, in the appearance of the disturbance preliminary phase and magnetic cloud closely related to HCS [Ivanov and Petrov, 1999; Ivanov and Romashets, 1999; Ivanov et al., 1999].
Third, pay attention to various approaches to modeling of the near-Earth magnetic cloud in this disturbance: it is either a field of the heliospheric electrojet on HCS [Ivanov and Romashets, 1999], or a field of a powerless cylinder (part of a toroidal configuration related to the bipolar group in AR) [Watari et al., 2001; Webb et al., 2000a].
Fourth, bear in mind that the problem of the plasma origin may be related to the problem of the magnetic cloud origin. For example, Webb et al. [2000a] paid attention to the fact that in this magnetic cloud neither "plasma density pulse" nor any sign of the filament substance were observed contrary to the magnetic cloud in the 10-11 January 1997 event [Burlaga et al., 1998]. According to the Hudson et al. [1998] estimates based on the dimensions of "dimmings" in the soft X rays, the cloud contained only a small part of the total mass of CME. These observations contradict to the modeling of the initial configuration in which the filament substance was located within the cloud (magnetic bundle) [Gibson and Low, 2000]. It is possible that in this event the cloud is closely related (not only spatially but also by its origin) to HCS and presents an analog of rarefied plasmoids appearing in the magnetotail during the reconnection process [Kivelson and Khurana, 1995]. In favor of this assumption probably is the fact that there was no two-directional electron fluxes in the cloud [Shodhan et al., 2000; Webb et al., 2000a].
Fifth, clarify the reason of the discrepancy between the
directions of the magnetic axes of the bipolar group in AR to the
Sun and of the magnetic cloud near the Earth.
Webb et al. [2000a]
suggested that to the moment of its arrival to the Earth orbit the
cloud has turned around by
40o and shifted southward
by
30o from its initial position
such that the cloud axis became located
below the ecliptic plane. There is no such difficulty in the
alternate model of cloud generation on HCS
[Ivanov and Romashets, 1999].
The paper contains initial data and methods in section 2, section 3 is dedicated to the dynamics of the photospheric open field, subsector structure of the coronal field and solar activity phenomena, section 4 is dedicated to the dynamics of the subsector structure of the interplanetary medium, section 5 covers the 12-16 May, 1997 events, and section 6 is a discussion.
|
| Figure 1 |
|
| Figure 2 |
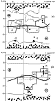
 from the center of the Sun) onto the photosphere using the
Levine et al. [1977]
method. In the process of such modeling, the
computer memorizes mutually-unambiguous relation between a
particular photospheric region of the open field (OR) and the
corresponding domain on the source surface. As a result, it becomes
possible to obtain synoptic maps of the Sun in the Mercator
projection. Combined on these maps are ensembles of photospheric
ORs and the subsector structure of the solar magnetic field with
the sector and intersector boundaries (Figures 1 and 2). Further,
the following data were put onto these maps: the boundaries of the
coronal holes in the FeXIV line observed at the Sacramento Peak
Observatory, magnetic fields of the sunspot groups observed at the
Kitt Peak Observatory, active filaments (Table 1), and flares
(Solar-Geophysical Data, Boulder, NN 637-640, 1998).
Then (1) a
piece of the disk with the width
DL = 150o
centered
at the Carrington longitude
L = 140o where the solar
activity events responsible for the near-Earth disturbance on
14-16
May
1997 were observed; and (2) slow (from one rotation to another)
dynamics of the open regions, solar activity events, and the sector
structure of the coronal field on the source surface were
considered on this piece of the disc during four Carrington
rotations (CR 1920-CR 1923: March-June 1997).
from the center of the Sun) onto the photosphere using the
Levine et al. [1977]
method. In the process of such modeling, the
computer memorizes mutually-unambiguous relation between a
particular photospheric region of the open field (OR) and the
corresponding domain on the source surface. As a result, it becomes
possible to obtain synoptic maps of the Sun in the Mercator
projection. Combined on these maps are ensembles of photospheric
ORs and the subsector structure of the solar magnetic field with
the sector and intersector boundaries (Figures 1 and 2). Further,
the following data were put onto these maps: the boundaries of the
coronal holes in the FeXIV line observed at the Sacramento Peak
Observatory, magnetic fields of the sunspot groups observed at the
Kitt Peak Observatory, active filaments (Table 1), and flares
(Solar-Geophysical Data, Boulder, NN 637-640, 1998).
Then (1) a
piece of the disk with the width
DL = 150o
centered
at the Carrington longitude
L = 140o where the solar
activity events responsible for the near-Earth disturbance on
14-16
May
1997 were observed; and (2) slow (from one rotation to another)
dynamics of the open regions, solar activity events, and the sector
structure of the coronal field on the source surface were
considered on this piece of the disc during four Carrington
rotations (CR 1920-CR 1923: March-June 1997).
The data on the interplanetary magnetic field (IMF) and solar wind plasma obtained on board the Wind satellite (the leading scientists were P. Lepping and K. Ogilvie, http://cdaweb.gsfc.nasa.gov) obtained in the scope of the International Solar-Terrestrial Physics Program (ISTP) were used to study the dynamics of the subsector structure of the interplanetary medium and the correspondence of this dynamics to solar events. A special attention has been paid to the 14-16 May 1997 disturbance.
The structure, configuration, and dynamics of the photospheric open regions, solar activity events (coronal holes, filaments, and active regions), and coronal magnetic field (sector and intersector boundaries) on the source surface in the sequence of four Carrington rotations CR 1920-CR 1923 are considered below.
The photospheric open field (closed circles) is mainly concentrated
in the polar caps (at the heliolatitudes
|F|  70o ).
The
positive and negative polarity lines are located in the Northern
and Southern
hemispheres, respectively.
70o ).
The
positive and negative polarity lines are located in the Northern
and Southern
hemispheres, respectively.
However, part of the open lines exits outside the polar caps to lower latitudes (the groups of larger circles designated as +2 and -1, -2 in the Northern and Southern hemispheres, respectively). Moreover, in the Northern hemisphere there is a low-latitude photospheric open region designated as +1.
The distance between ORs of opposite polarity,
r > R, manifests a
remote interaction between these ORs which allows for formation of
low-latitude coronal holes (thin curves) and active filaments (line
segments),as well as for a deformation of the sector boundary on
the source surface (solid curve)
[Ivanov et al., 2001b].
The coronal field on the source surface is mainly formed by the open lines emerging from the polar caps. Moreover, there are several subsectors ( +1; +2; -1; -2 ) formed by the open lines going out from the corresponding open photospheric regions shown on the map by large black circles. The intersector boundaries on the source surface (the boundaries of subsectors) are shown by thin lines.
It is worth noting the following: (1) The helioprojection of the Earth passes through two low-latitude coronal holes formed by the open lines emerging from the photospheric polar regions (from the caps and OR +2 and -2 ). Levine et al. [1977] were the first to draw attention to such specific low-latitude holes. (2) There are several active filaments in the vicinity of the sector boundary. (3) There is no active regions (except one very small region near the joint of HCS and the -2 intersector boundary). During this rotation, a very durable (22-28 March) high-velocity flow was observed near the Earth with complicated profiles of the velocity V, concentration n, and temperature T, the profiles indicating to a loading of the flow by the filament substance.
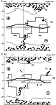
On 15 April the following changes happened in the ensemble of ORs on the piece of the solar surface considered: (1) in the Northern hemisphere, OR +2 disappeared, a high-latitude region was formed at the OR +1 meridian, and the OR +1 region itself expanded northward toward OR +3; (2) in the Southern hemisphere, OR -2 disappeared and OR -1 was shifted eastward, its area increasing significantly.
Interactions between ORs of the opposite polarity determined by the
distance between the centers of OR
+1 and OR
-1 ( r > R ) still
remains a remote one. The field on the source surface is still
formed mainly be the open lines emerged form the polar caps.
However, the Earth's helioprojection goes though the subsector
structure of the coronal field formed by the open lines going out
from the OR
+1 and OR
-1 midlatitude parts of the photosphere.
The sector boundary is in a considerable nonequilibrium in the sense that during the 8-11 April and 12-17 April periods it is formed by the oppositely directed open lines of the midlatitude OR +1 and southern polar cap, and OR -1 and the Northern cap, respectively. As a result of this nonequilibrium, the sector boundary gets bows to the north and south from the equator, respectively.
The following should be noted
1. Though the total area of the low-latitude coronal holes was reduced as compared to CR 1920, a small coronal hole in the vicinity of the joints of the sector and subsector boundaries is visually seen. Nevertheless, this coronal hole is still formed by the open lines going out from the OR -1 photospheric region located at higher latitude that the this hole.
2. Below the subsector boundary of OR -1, there appeared a low-latitude active region 8032 of the new solar activity cycle. On 15 April at 1410 UT, there occurred a solar flare of a moderate (maximum) optical ball SN(1N)/C1.0 in the point with the coordinates S23 E09 (Solar-Geophysical Data, Boulder, NN 637-640, 1998). It is interesting that the position of this flare relative the equator and central meridian was almost mirror as compared to the 12 May flare (see section 3.3) responsible for the prominent near-Earth disturbance on 15 May 1997.
3. There was almost no filaments in the vicinity of the Earth's helioprojection.
During this rotation near the Earth, as well as in CR 1920, a high-velocity flow from the coronal hole was observed, the flow having shorter duration and relatively smooth profiles of V, n, and T.
In the Northern hemisphere, almost complete dissipation of OR +1 happened, whereas OR +3 was shifted eastward. In the Southern hemisphere, there further shifting of OR -1 eastward and equatorward happened. The interaction between ORs still is remote, and the subsector structure on the source surface stays almost unchangeable. The nonequilibrium of the sector structure is mainly conserved.
The most significant change of the activity complex as compared with CR 1921 was an appearance of an active filament and active region in the vicinity of the joint between the sector and intersector boundaries in addition to the coronal hole which existed in the previous rotations. In the active region in the N23 W09 point a flare 1n(C.1.3) occurred at 0445 UT on 12 May 1997 and initiated the solar-terrestrial disturbance on 12-16 May 1997. Thus the very destabilization of the (A-AD-CH-HCS) activity complex formed near the joint of the sector and intersector boundaries between CD 1921 and CR 1922 became a cause of the corresponding disturbances on 14-16 May 1997.
Therefore, to create a qualitatively correct scenario and MHD model of this disturbance, one should take into account the entire complex of the solar activity and the influence of its components (coronal holes, filaments and heliospheric current sheet) on generation and propagation of the shock wave, magnetic cloud, and solar and galactic cosmic rays, whereas in the majority of the papers dedicated to the 12-16 May 1997 event, only the sporadic phenomena related to AR 8038 were taken into account. The heliospheric current sheet was taken into account by Sanderson et al. [1998] and the current sheet and active filament were taken into account by Ivanov and Romashets [1999] and Ivanov and Petrov [1999]. Lario [[2000] noted that corresponding high-velocity flow measured by Ulysses on 19 May 1997 was recurrent. Till now nobody has considered the low-latitude coronal hole (Figure 2a) as one of the sources of the near-Earth disturbance.
Comparing the CR 1922 and CR 1923 rotations, one can conclude that in the space between OR +3 and OR -1 a decay of the activity complex responsible for the 12-16 May 1997 disturbance occurred. Actually, the active region with the bipolar group has disappeared, though on the place of the complex there are still observed two active filaments and a low-latitude coronal hole. Their mutual position became less compact and their geometric characteristics changed. These "remnants" of the complex still are located near the joint of the sector and intersector boundaries, but the former has a zero inclination relative the equator contrary to CR 1922.
It is possible that the decay of this complex is related to two events: (1) to the energy loss in the May 1997 sporadic events and (2) to the decrease of the energy income into the interaction region of the pair of the OR +3 and OR -1 open regions. The latter suggestion is confirmed by a depletion of the OR +3 region area as compared with the two previous rotations.

|
| Figure 3 |

|
| Figure 4 |
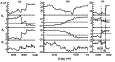
The wind velocity is characterized by a well-pronounced dynamics. At the initial stage of the complex development (CR 1920), there is a complicated profile formed by a sequence of two flows. At the formation and destabilization stages (CR 1921-CR 1922), there is a high-velocity flow almost stable during 2 days in the duration, intensity and profile shape. At the decay phase (CR 1923), there is a stationary slow solar wind. It is worth noting that the V profiles in the CR 1921 and CR 1922 rotations are so similar that one can come to the conclusion that there is an absence of any influence of the known sporadic events of 12 May 1997 [Hudson et al., 1998; Plunkett et al., 1998; Thompson et al., 1998; Webb et al., 2000a, 2000b].
Evidently, this stability of the velocity profile is due to the fact that the dynamics of the solar wind velocity near the Earth was mainly governed by the dynamics of the low-latitude coronal holes responsible for this flow. Actually, in the beginning (CR 1920, Figure 1a) a sequence of two large holes was observed. However, the first one is formed by the open lines from the polar cap photosphere, whereas the second is screened from the Earth by the heliospheric current sheet. Probably this fact predetermined the low velocity in the first flow and the complicated profile of the velocity in the second flow. The maximum velocity in the second flow was caused by a break of the screening due to the Earth crossing of the heliospheric current and entering the coronal hole. During the two following rotations (CR 1921 and CR 1922) the helioprojection of the Earth passed across the same coronal hole which was stable in its shape and position and formed by the open lines emerged from the midlatitude photosphere.
Thus the question arises, how the coronal mass ejection 12 of May 1997 influenced the velocity profile near the Earth? To answer this question we should pay attention to fine features of the velocity profile near the Earth in Figure 3. Ivanov and Romashets [1999] and Ivanov and Petrov [1999] paid attention to the fact that the near-Earth disturbance of 14-16 May 1997 was characterized by a three-phase time dynamics. A sequence of development (G), main (M), and recovery (R) phases and also its manifestation in all parameters of the solar wind plasma and IMF components are typical for this dynamics. Figure 3 confirms the presence of the three-phase dynamics in the velocity profiles observed during CR 1921 and CR 1922.
One should note a small difference in the May and April (CR 1922) profiles: (1) The development phase is better pronounced in April than in May, (2) the main phase starts from the SI flow surface in April and Sf forward shock wave in May, (3) the directions of the velocity changes are different during the main phase: there is a decrease in April soon after SI and a durable increase in May after Sf, and (4) the flow is observed between the sector and one of the intersector (HCS and SB) boundaries in April and between two intersector boundaries in May.
These differences may be interpreted (see also the concentration and IMF profiles) as effects of a modification of the initial high-velocity flow observed during the CR 1921 rotation (April) and interactions in the (AR-CH-ADF-HCS) complex formed after the flow destabilization in May 1997. These effects were (1) a formation of slow, dense, and cool heliospheric plasma layer because of the deceleration of the flow due to the ADF active filament on the HCS current sheet, and (2) generation of the shock wave both due to some acceleration of the flow from the coronal hole induced by the energy input from CME of 12 May 1997 and to lowering of the threshold for the generation of a rapid magnetosonic shock wave while it was propagating though the dense and cold plasma of the active filament.
To interpret qualitatively the velocity profiles in CR 1921 and CR 1922, it is useful to take into account two factors, one accelerating and the other decelerating the flow. The acceleration could be caused by AR 8026 (S24 E09) and AR 8038 (N21 W09) (Solar-Geophysical Data, Boulder, NN 637-640, 1998) in which there were observed flares of the sn and 1n balls on 16 April and 12 May, respectively. The deceleration could be due to the phenomena of "loading" of the high-velocity flows by the active filaments' substance (Table 1).
The variations of N in the high-velocity flow before and after the solar activity complex destabilization (CR 1921 and CR 1922) are the most interesting.
These profiles are similar, but there are also considerable differences between them. First, a strong and durable increase of the concentration in the head part of the flow was observed during both rotations. However, in CR 1921 it was a rather smooth compact variation with a sharp increase and smooth decrease, almost entirely located on HCS (between the sector and subsector boundaries, the latter in this rotation almost completely coinciding with the flow surface). As for the increase in CR 1922, it was a more irregular growth with a sharp depletion of the concentration at the front boundary of the cloud. The increase consisted of two parts: the increase during the development phase of the disturbance (in front of HCS and shock front) and the increase in the shock layer in front of the magnetic cloud.
Second, the concentration within the cloud is depleted in both
rotations. However, the concentration profile in CR 1921 is almost
flat ( N const), whereas this profile in
CR 1922 is irregular
with a decrease of
N in the magnetic cloud and a train of
high-amplitude fluctuations upward along the flow from the cloud.
This feature of the N profile in CR 1922 may be qualitatively explained by the presence of relatively dense heliospheric plasma sheet formed in the interaction of ADF and HCS [Ivanov and Romashets, 1999]. The latter (as it has been shown above, see Figure 2a) was adjacent to the low-latitude coronal hole. The N profile in the previous rotation CR 1921 was more smooth since in this rotation, though a hole in the vicinity of HCS was observed, there was no such powerful filament as ADF (Figure 1c).
Ivanov [[2001] proposed calling such increase of the density within high-velocity flows a "loading" by active filaments' substance. Moreover, the high-velocity flow in question was "loaded" by magnetic cloud as well. It should be noted that Webb et al. [2000a] indicated that this cloud is located in the front part of the high-velocity flow, though they did nor discuss the nature of this flow; it was presumed that the flow was a posteruptive flow being part of the halo-like CME formed in AO 8038.

|
| Figure 5 |

|
| Figure 6 |

|
| Figure 7 |

|
| Figure 8 |
At the stage of the activity complex development (CR 1920 and CR 1921), the near-Earth satellites should have been located mainly in the IMF negative sector (Figure 1). This statement is confirmed by the IMF measurements at the Wind satellite (Figures 5, 6, 7, and 8). Actually, the field almost all the time is directed sunward ( Bx >0 ) and westward ( By < 0 ). Only during some short periods does the IMF direction change to the opposite. The magnetic fluctuation level is high, the fact additionally indicating that the satellite orbit is close to HCS and that the latter is unstable. The destabilization of the solar activity complex (CR 1922) initiated a near-Earth disturbance during which the Wind satellite exited the positive sector and (after triple crossing of the sector boundary at 0038 UT, 0518 UT, and 0950 UT on 15 May) entered first the magnetic cloud (0951 UT) and then, after exiting the cloud (~2330 UT on 15 May) almost till 0300 UT of 17 May was located mainly in the IMF negative sector ( Bx > 0, By < 0 ). Therefore, the magnetic cloud in the 15 May disturbance was located at the heliospheric current sheet and its nature might have been closely related to the magnetic field of this layer, the field of the heliospheric electrojet [Ivanov and Romashets, 1999]. The fact that the cloud was close to HCS was not taken into account in the known publications [Watari et al., 2001; Webb et al., 2000b] dedicated to modeling of this cloud by solving the inverse problem in which the geometric characteristics of a powerless cylinder configuration are determined from the experimental profiles of the Bx, By, and Bz components.
Moreover, it was assumed in the above-mentioned publications that the cloud was a magnetic bundle, a part of the coronal mass ejection from AR 8038. Below we consider in detail various properties of the solar-interplanetary disturbance of 12-16 May 1997 including the nature and modeling of the magnetic cloud.
The dynamics, structure, and configuration of the near-Earth interplanetary disturbance of 14-18 May 1997 are considered in this section in detail. The aim of the consideration is to reveal characteristics of this disturbance which are detected experimentally and can be used for testing various MHD models oriented to this very disturbances.
The structure of this disturbance in the interplanetary medium near the Earth was considered by Ivanov and Petrov [1999], Ivanov and Romashets [1999], Ivanov et al. [1999], and Webb et al. [2000a]. Three phases of this disturbance were detected: preliminary (the development phase G) (~0810 UT on 14 May-~0110 UT on 15 May), main phase M (from 0110 UT on 15 May to ~0300 UT on 16 May), and recovery phase R (after 0300 UT on 16 May). It was shown that the G phase is a monotonic variations of the IMF components modulated by almost continuous train of nonlinear Alfvén waves and rotational ruptures [Ivanov and Petrov, 1999; Ivanov et al., 1999]. It was suggested that the G phase is a preliminary result of the interaction between ADF and HCS contained in the activity complex in question (Figure 2a). Further on, the sporadic coronal mass ejection CME from AR 8038 becomes involved into the interaction and the main phase of the disturbance occurs. Namely during the main phase of the disturbance the shock wave and magnetic cloud are observed. However, one should bear in mind that the shock wave and cloud are interacting with HCS and slow dense solar wind from the active filament ADF [Ivanov and Romashets, 1999]. Moreover, it was found (Figure 2a) that the high-velocity flow from the low-latitude coronal hole CH also becomes involved into interaction, so as a result we have in this disturbance a complicated CME-CH-ADF-HCS interaction. This fact should be taken into account in interpretation and modeling of this disturbance.
Below we consider in more detail the structure and configuration of the main phase of this disturbance. Table 2 shows the results of determination of the jN and qN showing the direction of the prevailing propagation of nonlinear waves and ruptures (RDs) during the development phase of the disturbance. Also presented in Table 2 are normals to the heliospheric current sheet HCS1, HCS2, HCS3, and HCS4, to the forward shock wave Sf, and to the magnetic cloud boundary in the entrance R I and exit R II points.
The scatter matrix method is used to determine these directions; the coordinates are solar ecliptic. The normals to Sf and R I determined by Berdichevsky et al. [[2000] and calculated by us from the magnetic cloud geometric characteristics obtained by Webb et al. [2000a], respectively, are marked by asterisks.
|
| Figure 9 |

|
| Figure 10 |
These results confirm the assumption that since the complicated solar source of the disturbance included a piece of the heliospheric current sheet( Figure 2a), this fact should have been manifested in the structure of the near-Earth disturbance. Certainly, an explicit MHD model should reproduce all the sequence of the structural elements shown in Table 2.
Concluding, we note that the observed distance of the forward shock
wave from the front point of the cloud was in this disturbance
1.3  1012 cm
which (under the Mach number
M = 2.1 [Berdichevsky et al., 2000])
is very close to the theoretical value for a cloud
with a shape of a circular cylinder
[Belotserkovskiy, 1957].
However, the normals to
Sf and
R I are directed southward and
northward, respectively (Table 2), which provides difficulties in
connecting
Sf to the magnetic cloud.
1012 cm
which (under the Mach number
M = 2.1 [Berdichevsky et al., 2000])
is very close to the theoretical value for a cloud
with a shape of a circular cylinder
[Belotserkovskiy, 1957].
However, the normals to
Sf and
R I are directed southward and
northward, respectively (Table 2), which provides difficulties in
connecting
Sf to the magnetic cloud.

|
| Figure 11 |
The amplitude of the effect (~1-1.5%) is anomalously small from the point of view of statistical relations with the interplanetary medium characteristics [Belov et al., 2001]. For example, the expected values of the amplitude for the disturbance of 15 May 1997 ( V max = 500 km s -1, B max = 25 nT) is
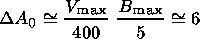 |
which is by a factor of 4.5 higher than the observed amplitude.
The temporal behavior of the amplitude is unusual since large-scale Fluctuations of GCR with the amplitude comparable to that of the "main" depletion has been observed both before and after the Forbush decrease.
Thus the Forbush effect is anomalous by its amplitude and unusual by its shape. The galactic cosmic ray (GCR) variations were compared to the MHD structure of the disturbance (Figures 9 and 10, Table 2) and led to the following conclusions: (1) The preincrease was observed in the negative IMF sector from the moment of the sharp decrease of the propagation direction of the nonlinear MHD waves and raptures (RD) to the moment of crossing HCS1, entering the IMF positive sector, and arrival of the shock front. (2) The sharp fluctuations of the increase, decrease, and again increase of A0 almost coincided with the moments of the HCS1, HCS2, and HCS3 crossings of the heliospheric current sheet, respectively, and were observed within the positive, negative, and again positive IMF sectors. (3) The "main" depletion was observed within the magnetic cloud ( R I-R II ). The nature of the Forbush effect being closely related to the MHD structure of the near-Earth disturbance, is nevertheless still obscure.
The preincrease has the most clear interpretation as a typical event caused by the reflection and acceleration of particles at the shock front [Dorman et al., 1970; Ruffolo, 1999; Ruffolo et al., 1999].
For the model with an exponential decrease of A0 upward the flow from Sf [Ruffolo, 1999] one can write
 |
where
B and
C are constants,
Z is the coordinate perpendicular to
the front,
k is a spatial scale of the preincrease (equal to
D/U in
the theory and evaluated in the experiment as
Vsf t where
D,
U,
Vsf, and
t are the diffusion coefficient, the solar wind
velocity in the shock front coordinate system and along the magnetic
field, and the duration of the preincrease. In the event in
question:
Vsf =380 km s
-1,
t = 12 hours,
k-1 = 1.5 1012 cm,
D  3.5
1019 cm
2 s
-1,
and the transport path of particles
with rigidity 10 GV
l II = 3D/C
3.5
1019 cm
2 s
-1,
and the transport path of particles
with rigidity 10 GV
l II = 3D/C  3.5 1012 cm. Moreover,
DA0
1% in this event (Figure 11)
and the ratio of the tangential
components of the magnetic field at the shock front is
Bt 2)/Bt
1 4 and agrees by a factor of 2 with the
theoretical model of the preincrease
[Ruffolo, 1999].
3.5 1012 cm. Moreover,
DA0
1% in this event (Figure 11)
and the ratio of the tangential
components of the magnetic field at the shock front is
Bt 2)/Bt
1 4 and agrees by a factor of 2 with the
theoretical model of the preincrease
[Ruffolo, 1999].
Still more difficult is the problem of interpretation of the GCR variations after the shock front passage. In general, one can conclude that these variations are due to the GCR interaction with the "crimped" HCS and magnetic cloud. A complete answer requires a knowledge on how the specific MHD disturbance structure has occurred. In general, it is clear that it was formed as a result of the interaction with the HCS of the high-velocity flow activated by CME from AR 8038 (see sections 4.1-4.3). However a specific scenario of the formation of this structure still is obscure. One of the possibilities is to assume that the entire complicated structure of the MHD disturbance, including the "crimped" HCS and magnetic cloud, has been formed in the interaction of the activated high-velocity flow with HCS. This scenario is close to the one suggested earlier by Ivanov and Romashets [1999]. In the second version, the "crimped" HCS (but not the magnetic cloud) and corresponding fluctuations of GCR could have appeared in a collision with HCS of the magnetic cloud which has come from AR 8038. It is a modification of the Webb et al. [2000a] scenario in which HCS was not taken into account.
Thus unusual shape of the Forbush effect provides no arguments in favor of this or that hypothesis of the magnetic cloud origin. At the same time, the properties of the Forbush variations found above and their relation to the MHD disturbance confirm a need to take into account the SME interaction with HCS while interpreting and modeling this disturbance.
The anomalously small amplitude of the Forbush effect also cannot be a serious argument in favor or against any of the above described hypotheses, though we think that this amplitude is more consistent with the model of the cloud formation on HCS. Relating to this, we emphasize that the "main" depletion of A0 in the magnetic cloud (Figure 11) looks in this event as a normal decrease typical for the entire IMF positive sector. Actually, if one takes into account the sequence of three GCR decreases in the positive sector (the fluctuation behind Sf, the "main" depletion in the magnetic cloud, and the decrease after ~0400 UT on 16 May), then the "main" depletion has an intermediate value by the amplitude which indicate to a recovery of A0 after the strongest decrease up to 1.5% in the sharp fluctuation behind the shock front.
To chose the hypothesis of the magnetic cloud origin, it would have been useful to consider in detail the variations of all the components of the anisotropy vector A1. Figure 11 shows the amplitudes of its components in the ecliptic plane Axy. Within the cloud the amplitudes fall down to the minimum value at the nearest distance from the cloud axis.
In this event a considerable component
Az 1% directed
northward was observed during the entire period of the cloud
passage. Thus one can make a preliminary conclusion that the data
on the anisotropy vector variations are in favor of the hypothesis
of the cloud formation on HCS, for example as a result of the
mechanism which is proposed to explain formation of plasmoids in
the magnetospheric tail
[Kivelson and Khurana, 1995]:
reconnection
under a tiring-instability in the neutral layer.
The Forbush effects of this disturbance were studied also in the integral ( E > 50 MeV) GCR flux on the basis of the observations at the SOHO satellite [Makela et al., 1998] and in the ultra-relativistic part of the spectra on the basis of the data of the muon telescope network [Munakata et al., 2000].
This event is considered as a rare radio-rich event [Gopalswamy et al., 2000] because of the presence in it together with the meter and kilometer radiobursts also of the deka- and hectometer radiobursts. According to the observations on board the Wind satellite (http://lep694.gsfc.nasa.gov/waves), there is no smooth transition between these wave ranges, whereas in the interplanetary medium the burst is weak and discontinuous [Reiner et al., 1998], the fact allowing us to assume that it was screened by the heliospheric plasma layer [Ivanov and Romashets, 2001].
The weak radioburst at the frequency
f0
150 kHz occurred in
the interplanetary medium about 1800 UT on 13 May and lasted with
some variations of the spectrum and small interruptions till ~0300 UT
on 14 May. In the interval between 0300 and 0300:30 UT a rapid
decrease of the frequency down to
f1 90 kHz was observed
with
a transition to a very narrow emission band. These variations in
the spectrum may be interpreted as a crossing by the shock front of
a sharp boundary from more dense and inhomogeneous medium to less
dense and more homogeneous medium. (If we estimate the density
change approximately as the ratio of the frequencies squared, we
obtain the density decreases by approximately a factor of 2.5.) For
example, the above fact might have been interpreted as an arrival
of the shock wave into the vicinity of the heliospheric current
layer or rarefied magnetic cloud.
Below we briefly discuss the results of the papers in the following topics: solar sources, near-Earth disturbances, solar-interplanetary phenomena, and modeling. The accent is made upon the particular results and problems of the study of the 12-18 May 1997 disturbance.
Analyzing the complex of solar, interplanetary and near-Earth data we show in this paper that (1) the active complex AR(sf)-CH-ADF-HCS, i.e., a complex solar source, was a cause of the near-Earth disturbance; and (2) this active complex was formed near the "joint" of the sector and intersector boundaries of the model coronal magnetic field on the source surface as a result of slow dynamics of the photospheric regions of the open field of the Sun.
These results specify ideas on the solar source of the near-Earth disturbance as compared both with the publications in which only the active region AR 8038 with the sf flare and small active filaments in this region is taken into account [e.g., Webb et al., 2000b], and with the Ivanov and Romashets [1999], who did not take the low-latitude coronal hole CH in the Fe XIV line into account.
Certainly, in the source (especially on the Sun) the most pronounced were the sporadic phenomena in AR 8038 (flare, Morton wave, CME) [Hudson et al., 1998; Plunkett et al., 1998; Sheeley et al., 1999; Thompson et al., 1998; Webb et al., 2000b]; however, the input of these sporadic events into the near-Earth disturbance, in our mind, needs specification. Also the input into this disturbance of the interactions of SME with HCS, ADF, and CH should be taken into account. This particular event confirms the tendency (which has been formed during the recent decade) to interpret the majority of near-Earth disturbances as complicated events with inputs from complex solar sources [Bravo et al., 1998; Crooker and McAlister, 1997; Gonzalez et al., 1996; Ivanov, 1996]. According to the terminology suggested by Ivanov [1998], the 12-18 May 1997 disturbance was a flare-hole-filament-strimmer one.
This event is the third in a series the events studied in which a complex solar source is formed near the joint of the sector and intersector boundaries as a result of slow dynamics of the photospheric regions OR of the open solar field. In two other cases, in July 2000 [Ivanov and Kharshiladze, 2002] and January 1997 (Ivanov et al., submitted manuscript, 2002) this fact was also emphasized. The tendency of activity complex to appear in the interaction region of ORs in the vicinity of sector and intersector boundaries [Ivanov et al., 2001b], in our opinion, agrees with the results which indicate to a frequent appearance of CME at the intersector chains of coronal streamers [Eselevich, 1995; Fainshtein, 1997; Hundhausen, 1993].
The problem of the interactions in a complex source which may begin on the Sun and be continued in the interplanetary medium till the arrival to the Earth orbit, is very important. In this event the source consist of closely located AR, ADF, HCS, and CH, and so one could expect a manifestation of these interactions in the data of solar observations.
One of such interactions (AR-HCS-CH) could, in our opinion,
be
manifested in the strong nonhomogeniety of the UV radiation front
which propagated over the entire solar disc with the Morton wave
after the flare at 0443 UT on 12 May
[Thompson et al.,
1998, Figure 2].
Thompson et al.
noted only the increase in the emission
and deceleration of the part of the front propagated northward, the
fact being interpreted as an interaction of the shock wave with the
north polar coronal hole. To complete, we compare Figure 2 of
Thompson et al. [1998]
to Figure 2a
of this paper and note
that the largest irregularity in the emission (at 0450-0507 UT in
the solar disk segment with
DF = 15o,
DL 20o and with the center at
F = S5,
L = W10 from
the flare meridian) almost completely covers the nearest to the
Earth piece of HCS and the low-latitude CH which were part of the
considered solar activity complex. This fact may be considered as
an indication to an interaction of the shock wave with HCS and CH
and to possible consequences of this interaction (besides the
nonhomogeneous front of the UV radiation, those are also a
formation of the magnetic bundle
[Gosling, 1990;
Marubashi, 1986]
and of the HCS bow
[Wu and Dryer, 1997]).
This fact has not been
taken into account in the MHD modeling of the Morton wave in the
12 May 1997 event.
Wu et al.'s [[2001]
Figure 4
shows a
comparison of the observations of the UV radiation front
[Thompson et al., 1998]
with the simulation results obtained under an
assumption that the wave propagates in a medium with constant
values of the density and temperature. As a result, the model front
was homogeneous in all directions, including southwestward from
the flare where the filament was located and a strong
nonhomogeniety of the emission was observed. Finally, modeling a
near-Earth disturbance, various alternatives should be considered
of the formation of the magnetic cloud observed
in
the near-Earth disturbance
[Ivanov and Romashets, 1999;
Makela et al., 1998;
Shodhan et al., 2000;
Watari et al., 2001;
Webb et al., 2000a, 2000b].
The near-Earth disturbances in the interplanetary medium on 14-16 May 1997 have been studied relatively weakly. The main attention has been paid to the MHD structure of the development phase of this disturbance [Ivanov and Petrov, 1999; Ivanov et al., 1999], to local models of the magnetic clouds based on the ideas on the heliospheric electrojet field [Ivanov and Romashets, 1999] and on powerless field of a circular cylinder [Watari et al., 2001; Webb et al., 2000a], and also to the energetic particles [Lario et al., 2000; Makela et al., 1998; Munakata et al., 2000; Sanderson et al., 1998; Shodhan et al., 2000; Torsti et al., 1998].
It was assumed in the very beginning that this is a complicated disturbance from the complicated solar source with the flare, active filament and heliospheric current sheet [Ivanov and Romashets, 1999]. Later it was found (see sections 3-4) that it is not enough, since we are dealing with a recurrent high-velocity flow form a low-latitude coronal hole modified by the interactions in the AR-CH-ADF-HCS complex.
However, this fact does not exclude the question on the magnetic cloud origin in May 1997. It was shown in section 4 that the cloud was observed on HCS and so, besides the assumption that the cloud is a magnetic bundle, a part of CME from AR 8038 [Gibson and Low, 2000; Webb et al., 2000a], it is desirable to bear in mind a possibility of generation of this cloud on HCS in the AR-CH-ADF-HCS complex by one of the mechanisms discussed in literature [Gosling, 1990; Ivanov and Romashets, 1999; Kivelson and Khurana, 1995; Marubashi, 1986; Wu and Dryer, 1997].
It is significant that contrary to the 5-12 January 1997 events (Ivanov et al., submitted manuscript, 2002) the determination of the normal to the cloud at the point of the entrance of the Wind satellite based on the geometric characteristics of a circular cylinder cloud in the Webb et al. [2000a] and Watari et al. [[2001] calculations does not contradict the determination of the normal by the scatter matrix method (Table 2). The cloud was neither strongly deformed nor strongly compressed, so the usual method of looking for configuration characteristics from the IMF components [Burlaga, 1988] is applicable to this cloud. The absence of a strong "density pulse" at the cloud rear wall and a Forbush increase of the GCR intensity within the cloud in the May event provide additional confirmation of the assumption on a significantly different degree of compression of these clouds. The latter means that the May cloud should not be classified as a "superexpanding" cloud in which strong currents at the cloud boundary and deviations of the cloud shape from a cylinder should be taken into account [Cargill et al., 2000; Schmidt and Cargill, 2001].
However, the position of the forward shock wave relative the front
boundary of the cloud does not agree completely with the
Berdichevsky et al. [[2000]
assumption that this is a deflected wave
under a quasi-stationary flowing around with the Mach number
M = 2. Actually, the normals to
Sf and
R I diverge by
30o and are
directed southward and northward, respectively. This means that
during 8.5 hours between the crossings of
Sf and
R I either the
magnetic cloud turned to the south by a jump or the wave changed
its direction sharply while crossing HCS or the cloud was not a
generator of this wave.
There is one more "configuration" problem of relation of this cloud to a solar source. It looks like the following. Webb et al. [2000a] came to the conclusion that the cloud axis lies southward from the Earth below the ecliptic plane. Our determinations by different methods confirm this conclusion (Table 2). To agree the position of AR 8038 (N23 W09) as a possible source of this cloud with the position of the cloud axis one has to suggest that on its way from the Sun to the Earth the cloud was shifted southward almost by 30o and turned anticlockwise by 50- 60o [Webb et al., 2000a]. No particular evidences have been presented in favor of these suggestions except the reference to the rotation in the proper direction of the active filament from this AR. In the cloud models oriented to its origin on HCS (for example, in the model with the heliospheric electrojet [Ivanov and Romashets, 1999]) the problem is easily eliminated since in the cloud observation, moment HCS in this event was located southward from the Earth (see section 4).
If we discuss the hypothesis on the shift and turn of the cloud, we should pay attention to the following: (1) the CME-halo was more bright at the north and east than at the south and west [Plunkett et al., 1998]; (2) some role was played by the interaction of the coronal shock wave with the HCS and CH located south-westward (this fact is manifested by the strong nonhomogeniety of the Morton wave [Thompson et al., 1998, Figure 2]; this interaction, in particular, could have generated the reflected wave pushing the cloud from AR 8038 northeast; (3) one has to agree the spheromack model by Gibson and Low [[2000] who applied it to AR 8038 AR in which the magnetic bundle (cloud) in the initial position was located along the neutral line of AR, whereas in the interpretation of Webb et al. [2000a] the initial position of the cloud was perpendicular to this line.
What was happening with this disturbance on the way from the Sun to the Earth one can only assume on the basis of the Forbush effects observed at the network of neutron monitors (see section 5.2) and muon telescopes [Munakata et al., 2000] and also on board the SOHO satellite [Makela et al., 1998]. These were observations of the particles with the rigidity of about 10 GV, 16-890 GV, and the integral flux of the particles with the rigidity above 50 MeV, respectively. It would be interesting to compare these results to the measurements in the spectrum of the kilometer emission of type II (see section 5.3).
The first thing we would like to point out to is an astonishing coincidence of the moments of the integral GCR flux preincrease observed on board SOHO [Makela et al., 1998] with the moment of the appearance of a weak kilometer radioburst of type II (see section 5.3). This coincidence occurred at about 1800 UT on 13 May and may be interpreted as a very quick reaction of GCR at the distance of ~0.5 AU from the Sun. Further on, till the arrival of the shock front to the Earth, the particle density increased by about 4%. Contrary to the Forbush effects in the ultrarelativistic part of the spectrum, the density variations in the integral flux behaved in agreement with the statistically mean characteristics [Belov et al., 2001]: a two-step (at the shock wave and in the magnetic cloud) decrease was observed, and the expected value of the decrease amplitude (~7%) was reached.
It is worth also noting that the beginning of the rigid GCR preincrease (~1500 UT on 14 May, see Figure 11) was close to the time of the sharp change of the propagation direction of the nonlinear MHD oscillations (RDs in Table 2). Not long before that (0300-0400 UT on 14 May) a sharp reconstruction of the spectrum of the type II radioburst occurred according to the observations on board the Wind satellite (see section 5.3). It is possible that these events indicate the fact that shortly before its arrival to the Earth the interplanetary wave took part in the interaction with large-scale irregularities of the interplanetary medium (magnetic cloud, HCS); however, the exact physical sense of these interactions is still obscure.
An explanation of the cloud spirality may present a difficulty in the hypothesis of the cloud formation on HCS. In this case (according to the spirality rules for the solar cycle [Bothmer and Schwenn, 1998]) it was a left-spiral SEN cloud [Webb et al., 2000a]. The cloud spirality near the Earth is easily explained by the magnetic field spirality of the bipolar group in AO 8038 [Webb et al., 2000a]; however, it is not clear which should be the spirality of the cloud generated on HCS. In relation to this we note that the same problem with the spirality appears in the work by Mulligan et al. [[2001], who have found a cyclic variation in the positive correlation between the directions of the magnetic clouds axes and the HCS inclination to the equator plane. In the event in question, the magnetic cloud could have been formed at the part of HCS formed by remote interactions of the pair of open regions +3/-1 (Figure 2a), which have the same longitudinal shift as the sunspots of the bipolar group in AR 8038. Probably, solving this problem, one would be able to explain the spirality of the magnetic cloud on 15 May 1997 without denying the assumption on its generation on HCS.
This event is presented above as consisting of a slow phase of gradual formation of the activity complex and rapid phase of this complex destabilization with a strong disturbance in the space between the Sun and the Earth.
Obviously, currently there is not enough either experimental data nor theoretical concepts which would make it possible to describe and model the entire chain of the events unambiguously and in detail. The most problematic aspect remains the description and explanation of the events during the slow phase. It is suggested [Ivanov et al., 2001b] that the photospheric regions of the modelled magnetic field of the Sun together with large-scale background magnetic fields [Bumba and Howard, 1965] are a result and manifestation of giant modes of the convective instability [Fox et al., 1998; Simon and Weis, 1968; Wilson, 1987, 1992; Wilson et al., 1990; Yoshimaru, 1971], the interactions between them generating solar activity complexes. This view on the origin and role of the open magnetic field of the Sun is an alternate hypothesis on generation of the open field in the active solar regions [Leigton, 1964; Wang et al., 2000]. Not rasing a discussion on this fundamental problem, we would like to draw attention to the fact that (as shown in sections 3.2 and 3.3) the appearance of the relatively separated open regions OR -1, +2, and +3 (Figures 1 and 2) and their tendency to a convergence preceded by almost one rotation the appearance of AR 8026 and 8038 and formation of the activity complex.
One more perspective approach to the interpretation of the dynamics
of the photospheric regions of the open magnetic field of the Sun
could be based on the concept of the Rossbi waves generated in the
convective zone of the Sun and having the characteristic linear
dimensions close to those of OR ( 0.5 R )
and a similar life-time
(about 10 solar rotations)
[Gilman, 1969;
Tikhomolov and Mordvinov, 1997].
The rapid phase scenario has more reliable and various experimental backgrounds than the slow phase scenario and makes some elements of modeling possible. It is mainly true for the events near the Sun and Earth. The data and ideas on what has been happening in the outer corona and interplanetary state still are limited and controversial.
In the scenario of the rapid phase which started on 12 May 1997 with sporadic events in AR 8038 [Gopalswamy et al., 2000; Hudson et al., 1998; Plunkett et al., 1998; Thompson et al., 1998; Webb et al., 2000a, 2000b], it is assumed (see sections 3 and 4) that in the vicinity of AR 8038 AR and the helioprojection of the Earth, there were located an active filament, part of the heliospheric current, and low-latitude coronal hole, all of them forming a united activity complex (Figure 2a).
Because of that, the sporadic disturbances formed in AR 8038 should have interacted with the above indicated structural formations and the results of this interactions could have been manifested: in the strong inhomogeneity of the Morton wave front (see section 6.1) in the vicinity of the photosphere; in decameter and hectometer radioemission in the outer corona; in the sharp changes of the spectrum of the kilometer radioburst of type II (see section 5.3); in multiple crossings of HCS associated with the forward shock wave and magnetic cloud in the near-Earth environment; and in the anomalous Forbush effect in the MHD and GCR precursors of the disturbance (see sections 5.1-5.2).
Certainly, the observations by
Gopalswamy et al. [[2000],
Hudson et al. [1998],
Lara et al. [[2000],
Plunkett et al. [1998],
Sheeley et al. [1999],
Thompson et al. [1998],
and
Webb et al. [2000a, 2000b]
quite definitely show that AR 8038 was a source of the coronal mass
ejection with the shock wave, magnetic cloud, ejection of a small
filament, and posteruptive flow from the transient coronal holes.
So one can assume that near the Earth was observed the same CME
which had started from AR, if on the way to the Earth the cloud had
shifted southward by almost
30o and turned around the
longitudinal axis by
45o [Webb et al., 2000a].
The above mentioned condition is, in our opinion, the weakest point of this scenario. Moreover, neither the complicated complex of solar sources indicated above nor possible interactions and their consequences, especially in the near-Earth space, are taken into account in this scenario. Nevertheless, the scenario worth further study due to both the direct relation to the observed properties of AR 8038 (the comparison of magnetic clouds in AR and in the magnetic cloud, cloud spirality according to the Bothmer and Rusta rule) and the fact that the interactions and detailed features of the near-Earth disturbance found in this paper partially are able to be agreed with the Webb et al. [2000a] scenario. For example, if the consequences of the HCS collision with the magnetic cloud from AR were observed near the Earth, then one can consider as a result of this collision the multiple crossings of HCS in front of the front cloud boundary accompanied by large-amplitude fluctuations of the MHD parameters and GCR intensity (Figures 3, 4, 5, 6, 7, 8, 9, 10, and 11).
A different scenario of these disturbances is known in which the complexity of the source was taken into account, possible interactions were discussed, and it was suggested that the magnetic cloud was originated on HCS and may be presented as a heliospheric electrojet field [Ivanov and Romashets, 1999].
Taking into account the results of this study, this scenario may be presented in the following way.
1. On 12 May CME (the forward wave, magnetic cloud, posteruptive flow) starts from AR 8038, the south-western flank immediately interacting with ADF, HCS, and CH, this fact being manifested in the strong inhomogeneity of the Morton wave front [Thompson et al., 1998] and occurrence of the deca- and hectometer radiobursts of type II [Gopalswamy et al., 2000].
2. A new magnetic cloud (an analog of a plasmoid in the magnetotail [Kivelson and Khurana, 1995]) is born near the Sun in the CME-HCS interaction act and is captured into the high-velocity flow from the low-latitude coronal hole CH loaded by the substance of the active filament ADF.
3. The forward shock wave attenuates strongly, a return wave is formed, the magnetic cloud is pushed out of AR northeastward. This fact is manifested by the almost complete disappearance of the II-type radiobursts [Reiner et al., 1998] (see section 5.3) and a high intensity of the halo in its northeastern part [Plunkett et al., 1998].
4. The posteruptive flow from AR overtake the slower "loaded" high-velocity flow from CH and accelerates it with formation of a shock wave in the region of the interaction of these flows. These facts are confirmed by the occurrence of the kilometer radioburst of type II at about 1800 UT on 13 May and correspond to the Gopalswamy et al. [1998] hypothesis on generation of kilometer radiobursts in two-flow interaction acts.
5. At ~0300 UT on 14 May the newly generated wave reaches the rear wall of the magnetic cloud and enters it (that is confirmed by the sharp change of the spectrum of the radioburst of type II, see section 5.3), compresses and accelerates the cloud.
6. Subsequently, the acceleration of the cloud associated with HCS leads to oscillations ("crimping") of HCS (Figure 10) with a formation of a magnetic "mirror" responsible for the preincrease of GCR (Figure 11) and GCR fluctuations in front of the front boundary of the cloud.
The problem of the near-Earth cloud origin still stays under discussion; however, it seems necessary to take into account the complicated source and interactions in a qualitative scenario of the 12-16 May 1997 disturbances to formulate a set of experimental limitations to the results of MHD modeling of such simple (at the first sight) events of solar-terrestrial physics.
Applied to the solar-interplanetary disturbance of 12-18 May 1997, a possibility is demonstrated to study complicated solar sources, structure, configuration, and dynamics of near-Earth disturbances using slow dynamics of the photospheric regions of the open lines of the magnetic field of the Sun and a broad complex of solar observations and measurements in the interplanetary medium.
Is shown that (1) the compact activity complex formed in April-May 1997 in the vicinity of the "joint" between the sector and intersector boundaries of the magnetic field on the source surface was a cause of the disturbance in question; (2) the complex included also an active region, active filament outside this region, and coronal hole; (3) the complex generated in the interplanetary medium a high-velocity magnetoplasma flow with the life-time of about 4 solar rotations (from the birth to the decay); (4) an interplanetary disturbance with the three-phase temporal dynamics typical for the disturbances in the vicinity of the heliospheric current sheet was observed in April-May 1997 near the Earth; (5) the destabilization of the 12 May 1997 complex led to a significant modification of the near-Earth disturbance: to the appearance of a forward shock wave and magnetic cloud, to the multiple crossings of the heliospheric current sheet and to the flow acceleration; and (6) the close relation of the magnetic cloud to the heliospheric current layer, its geometric characteristics, and anomalously low amplitude of the Forbush decrease make possible an assumption that the magnetic cloud have been formed as a result of a reconnection of the magnetic field in the neutral layer of the heliospheric current layer.
Belov, A. V., et al., What causes Forbush effects and what are they related to?, Izv. Ros. Akad. Nauk, Ser. Fiz. (in Russian), 65 (3), 373, 2001.
Belotserkovskiy, O. M., Flowing around of a circular cylinder with a leaving shock wave, Dokl. Akad. Nauk SSSR (in Russian), 113 (3), 509, 1957.
Berdichevsky, D. B., A. Sabo, R. P. Vinas, and F. Mariani, Interplanetary fast shocks and associated drivers observed through the 23th solar minimum by Wind over its first 2.5 years, J. Geophys. Res., 105 (A12), 27,289, 2000.
Bothmer, V., and R. Schwenn, The structure and origin of magnetic clouds in the solar wind, Ann. Geophys., 16 (1), 1, 1998.
Bravo, S., X. Blanco-Cano, and E. Nikiforova, Different types of coronal mass ejections at minimum and maximum of solar activity and their relation to magnetic field evolution, Sol. Phys., 180 (1/2), 461, 1998.
Bruckner, G. E., et al., Geomagnetic storms caused by coronal mass ejections (CMEs): March 1996 through June 1997, Geophys. Res. Lett., 25 (15), 9019, 1998.
Bumba, V., and R. Howard, Large-scale distribution of solar magnetic fields, Astrophys. J., 141 (4), 1502, 1965.
Burlaga, L. F., Magnetic clouds, and force-free fields with constant alpha, J. Geophys. Res., 93 (A7), 7217, 1988.
Burlaga, L. F., K. W. Behannon, and L. W. Klein, Compound streams, magnetic clouds, and major magnetic storms, J. Geophys. Res., 92, 5725, 1987.
Burlaga, L. F., et al., A magnetic cloud containing prominence material: January 1997, J. Geophys. Res., 103 (A1), 277, 1998.
Cane, H. V., I. G. Richardson, and O. C. St. Cyr, The interplanetary events of January-May 1997, as inferred from energetic particle data, and their relationship with solar events, Geophys. Res. Lett., 25 (14), 2517, 1998.
Cargill, P. J., J. Schmidt, D. S. Spicer, and S. T. Zalezhak, Magnetic structure of overexpanding coronal mass ejections. Numerical models, J. Geophys. Res., 105 (A4), 7509, 2000.
Crooker, N. U., and A. N. McAlister, Transients associated with recurrent storms, J. Geophys. Res., 102 (A7), 14,041, 1997.
Dorman, L. I., N. S. Kaminer, and E. V. Kebuladze, Intensity increase of the cosmic rays prior to a Forbush decrease and strong shock waves in the interplanetary medium, Izv. Akad. Nauk SSSR, Ser. Fiz. (in Russian), 34 (11), 2360, 1970.
Dryer, M., and Z. K. Smith, MHD simulation of multiple interplanetary disturbances during STIP interval VII (August 1979), in Solar Maximum Analysis, edited by V. E. Stepanov and V. N. Obridko, p. 369, VNU Science Press, Utrecht, 1987.
Eselevich, V. G., New results on the site of initiation of coronal mass ejections, Geophys. Res. Lett., 22 (20), 2681, 1995.
Fainshtein, V. G., An investigation of solar factors governing coronal mass ejections characteristics, Sol. Phys., 174 (1/2), 413, 1997.
Fox, P., P. McIntosh, and P. R. Wilson, Coronal holes and polar field reversal, Sol. Phys., 177 (2), 375, 1998.
Gibson, S. E., and B. C. Low, Three-dimensional and twisted: An MHD interpretation of on-disk observational characteristics of coronal mass ejections, J. Geophys. Res., 105 (A8), 18,187, 2000.
Gilman, P. A., A Rossby-wave dynamo for the Sun, II, Sol. Phys., 9 (1), 3, 1969.
Glover, A., N. D. Runs, L. K. Harra, and F. L. Culhane, The onset and association of CMEs with sigmoidal arcs, Geophys. Res. Lett., 27 (14), 2161, 2000.
Gonzalez, W. D., et al., Coronal hole-active region-current sheet (CHARCS) association with intense interplanetary and geomagnetic storms, Geophys. Res. Lett., 23 (19), 2577, 1996.
Gopalswamy, N., et al., Origin of coronal and interplanetary shocks: A new look with WIND spacecraft data, J. Geophys. Res., 103 (A1), 307, 1998.
Gopalswamy, N., et al., Radio-rich solar eruptive events, Geophys. Res. Lett., 27 (8), 1200, 2000.
Gosling, F. T., Coronal mass ejections and magnetic flux ropes in interplanetary space, in Physical of Magnetic Flux Ropes, Geophys. Monogr. Ser., vol. 58, edited by C. T. Russell, E. R. Prist, and L. C. Lee, p. 330, AGU, Washington, D.C., 1990.
Gosling, J. T., The solar flare myth, J. Geophys. Res., 98 (A11), 18,937, 1993.
Hudson, H. S., J. R. Lemen, O. C. St. Cyr, A. C. Sterling, and D. F. Webb, X ray coronal changes during halo coronal mass ejections, Geophys. Res. Lett., 25 (14), 2481, 1998.
Hundhausen, A. F., The sizes and locations of coronal mass ejections, J. Geophys. Res., 98 (A12), 13,177, 1993.
Ivanov, K. G., Solar sources of the interplanetary plasma streams on the Earth's orbit, Geomagn. Aeron. (in Russian), 36 (2), 158, 1996.
Ivanov, K. G., Solar sources of interplanetary plasma streams at Earth's orbit, Int. J. Geomagn. Aeron., 1 (1), 1, 1998.
Ivanov, K. G., The loading of a coronal hole with an active filament: Influence on the dynamics and structure of near-Earth disturbances, Geomagn. Aeron. (in Russian), 41 (1), 1, 2001.
Ivanov, K. G., and A. F. Kharshiladze, Slow dynamics of open field lines as indicator of subphotospheric interactions, its relation to solar activity phenomena and near-earth disturbances. 2. The March-September 1999 events, Geomagn. Aeron. (in Russian), 42 (2), 155, 2002.
Ivanov, K. G., and V. G. Petrov, MHD structure of the precursors of interplanetary and geomagnetic disturbances, Geomagn. Aeron. (in Russian), 39 (4), 403, 1999.
Ivanov, K. G., and E. P. Romashets, Prominent 1997 ISTP phenomena, Proc. Workshop Present Achievement and Future Opportunities of ISTP and GEM, p. 27, sponsored by NASA NSF Southwest Research Institute, Yosemite, Calif., 1998.
Ivanov, K. G., and E. P. Romashets, Flare-filament-streamer interplanetary disturbances, Geomagn. Aeron. (in Russian), 39 (2), 135, 1999.
Ivanov, K. G., and E. P. Romashets, Heliospheric current sheet effect on propagation of type II interplanetary radio bursts from coronal mass ejections, Radio Sci., 36 (6), 1739, 2001.
Ivanov, K. G., E. P. Romashets, and V. G. Petrov, The wave vectors of nonlinear Alfvén waves at the growth phase of a flare-filament-streamer flow of interplanetary magnetoplasma, Geomagn. Aeron. (in Russian), 39 (5), 539, 1999.
Ivanov, K. G., V. Bothmer, P. Cargill, A. F. Kharshiladze, E. P. Romashets, and I. S. Veselovsky, Subsector structure of the interplanetary space, SOLSPA 2001 Euroconference: Solar Cycle and Space Weather, Vico Equense, Italy, ESA Spec. Publ. SP-477, p. 35, 2001a.
Ivanov, K. G., A. F. Kharshiladze, and A. N. Mel'nik, Slow dynamics of the open field lines as an indicator of underphotospheric interactions, its relation to solar activity events and near-Earth disturbances: 1. The July-October 1999 events, Geomagn. Aeron. (in Russian), 41 (6), 1, 2001b.
Kahler, S., Coronal mass ejections and streamers associated with the new cycle activity regions at solar minimum, Astrophys. J., 378 (1), 398, 1991.
Kharshiladze, A. F., and K. G. Ivanov, Spherical harmonic analysis of the solar magnetic field, Geomagn. Aeron. (in Russian), 34 (4), 450, 1994.
Kivelson, M. G., and K. K. Khurana, Models of flux ropes imbedded in a Harris neutral sheet, J. Geophys. Res., 100 (12), 23,637, 1995.
Lara, A., N. Gopalswamy, and G. DeForest, Change on photospheric magnetic flux during CMEs, Geophys. Res. Lett., 27 (10), 1435, 2000.
Lario, D., et al., Energetic protons observed at 1 and 5 AU: 1. January-September 1997, J. Geophys. Res., 105 (A8), 18,235, 2000.
Leigton, R. B., Transport of magnetic fields on the Sun, Astrophys. J., 140 (4), 1547, 1964.
Levine, R. H., M. D. Altschuler, and J. W. Harley, Solar sources of interplanetary magnetic field and solar wind, J. Geophys. Res., 82, 1061, 1977.
Makela, P., et al., Observation of galactic cosmic ray modulation during Earth directed coronal mass ejections, Geophys. Res. Lett., 25 (15), 2951, 1998.
Marubashi, K., Structure of the interplanetary magnetic clouds and their solar origins, Adv. Space Res., 6 (6), 33, 1986.
Mazur, J. E., et al., Solar energetic particles inside magnetic clouds observed with the Wind spacecraft, Geophys. Res. Lett., 25 (14), 2521, 1998.
Mogilevsky, E. T., V. N. Obridko, and B. D. Shelting, Large-scale magnetic field structures and coronal holes on the Sun, Sol. Phys., 176 (1), 107, 1997.
Mulligan, T., et al., Inversion studies of magnetic cloud structure at 0.7 AU: Solar cycle variation, Geophys. Res. Lett., 28 (5), 891, 2001.
Munakata, K., et al., Precursors of geomagnetic storms observed by the muon detector network, J. Geophys. Res., 105 (A12), 27,457, 2000.
Plunkett, S. P., B. J. Thompson, R. A. Howard, D. J. Michels, O. C. St. Cyr, S. J. Tappin, R. Schwenn, and R. L. Lamy, LASCO observations of an Earth-directed coronal mass ejection on May 12, 1997, Geophys. Res. Lett., 25 (14), 2477, 1998.
Reiner, M. J., M. L. Kaiser, J. Fainberg, and R. G. Stone, A new methods for studying remote type II radio emission from coronal mass ejection-driver shocks, J. Geophys. Res., 103 (A12), 29,651, 1998.
Ruffolo, D., Transport and acceleration of energetic charged particles near an oblique shock, Astrophys. J., 515 (P2), 787, 1999.
Ruffolo, D., J. W. Biber, P. Evenson, and R. Pyle, Precursors to Forbush decreases and space weather predictions, Proc. 26th Int. Cosmic Ray Conf., vol. 6, p. 440, 1999.
Sanderson, T. R., et al., Wind observation of the influence of the Sun's magnetic field on the interplanetary medium at 1 AU, J. Geophys. Res., 103 (A8), 17,235, 1998.
Schmidt, J., and P. J. Cargill, Magnetic cloud evolution in two-speed solar wind, J. Geophys. Res., 106 (A4), 8283, 2001.
Sheeley, N. R., J. H. Walters, Y.-M. Wang, and R. A. Howard, Continuous tracking of coronal outflows: Two kinds of coronal mass ejections, J. Geophys. Res., 104 (A11), 24,739, 1999.
Shodhan, S., et al., Counterstreaming electrons in magnetic clouds, J. Geophys. Res., 105 (A12), 27,261, 2000.
Simon, G. W., and N. O. Weiss, Supergranules and the hydrogen convection zone, Z. Astrophys., 69 (6), 435, 1968.
Thompson, B. J., S. P. Plunkett, J. B. Gurman, J. S. Newmark, O. C. St. Cyr, and D. J. Michels, SOHO/EIT observations of an Earth-directed coronal mass ejection on May, 12, 1997, Geophys. Res. Lett., 25 (14), 245, 1998.
Tikhomolov, E., and V. Mordvinov, Rossby fortices in the layer between convection zone and radiative interior, Sol. Phys., 172 (1), 196, 1997.
Torsti, J., A. Antila, L. Kocharov, P. Makela, E. Rihonen, T. Sahla, M. Teittinen, E. Valtonen, T. Laitinen, and R. Vainio, Energetic (~1 to 50 MeV) protons associated with Earth-directed coronal mass ejections, Geophys. Res. Lett., 25 (14), 22,525, 1998.
Wang, Y. M., N. R. Sheeley, and J. Lean, Understanding the evolution of the Sun's open magnetic flux, Geophys. Res. Lett., 27 (5), 621, 2000.
Watari, S., T. Watanabe, and K. Marubashi, Soft X ray solar activity associated with interplanetary magnetic flux ropes, Sol. Phys., 202 (2), 363, 2001.
Webb, D. F., R. P. Lepping, L. F. Burlaga, and C. E. DeForest, The origin and development of the May 1997 magnetic cloud, J. Geophys. Res., 105 (A12), 27,251, 2000a.
Webb, D. F., E. W. Cliver, N. U. Crooker, O. C. St. Cyr, and B. J. Thompson, Relations hip of halo coronal mass ejections, magnetic clouds, and magnetic storms, J. Geophys. Res., 107 (A4), 7491, 2000b.
Wilson, P. R., Solar rotation and giant celles, Sol. Phys., 110 (1), 59, 1987.
Wilson, P. R., The reversal of the solar magnetic fields, Sol. Phys., 138 (1), 11, 1992.
Wilson, P. R., P. S. McIntosh, and H. B. Snodgrass, The reversal of the solar polar magnetic fields, Sol. Phys., 127 (1), 1, 1990.
Wu, C. C., and M. Dryer, Three-dimensional MHD simulation of IMF changes at 1 AU caused by a simulated solar disturbances and a titled heliospheric current/plasma sheet, Sol. Phys., 173 (2), 391, 1997.
Wu, S. T., H. Zheng, S. Wang, B. J. Thompson, S. Plunkett, X. P. Zhao, and M. Dryer, Three-dimensional numerical simulation of MHD-waves observed by the Extreme Ultraviolet Imaging Telescope, J. Geophys. Res., 106 (A11), 25,089, 2001.
Yoshimaru, H., Complexes of activity of the solar cycle and very large-scale convection, Sol. Phys., 18 (3), 417, 1971.