
S. Mühlbachler,1 C. J. Farrugia,2 H. K. Biernat,3 D. F. Vogl,3 V. S. Semenov,4 P. Aber,5 J. M. Quinn,2 N. V. Erkaev,6 K. W. Ogilvie,7 R. P. Lepping,7 S. Kokubun,8 and T. Mukai9
1Space Research Institute, Austrian Academy of Sciences,
Graz, Austria
2Institute of the Study of Earth, Oceans, and
Space, University of New Hampshire, Durham, New Hampshire, USA
3Space
Research Institute, Austrian Academy of Sciences,
Graz, Austria
4Institute of Physics,
St. Petersburg State
University, St. Petersburg, Russia
5Faculty of Arts and Sciences, Harvard University, Cambridge,
Massachusets, USA
6Institute of
Computational Modelling, Russian Academy of Sciences,
Krasnojarsk, Russia
7NASA
Goddard Space Flight Center,
Greenbelt, Maryland, USA
8Solar-Terrestrial
Environment Laboratory, Nagoya University, Nagoya, Japan
9Institute of Space and
Astronautical Science, Kanagawa, Japan
Received 3 May 2001, published online 24 August 2001
|
|
| Figure 1 |
Magnetic clouds are very useful for investigating the interaction between the solar wind and the magnetosphere because of their special properties, which allow them to couple energy and momentum to the magnetosphere, thus driving storms and substorms. Interplanetary magnetic clouds are characterized by (1) strong magnetic field strengths relative to ambient values, (2) low proton b and proton temperature, and (3) large and smooth rotation of magnetic field direction [Burlaga et al., 1981; Lepping et al., 1990].
Their passage at Earth typically lasts about 1-2 days, and their dimension at AU is ~0.25 AU. Furthermore, magnetic clouds are often a dramatic source of long-lasting, strong, negative Bz of interplanetary magnetic field, which is an optimum condition for reconnection at the dayside magnetopause. Ahead of fast magnetic clouds, interplanetary shocks are often observed [Burlaga, 1995].

|
| Figure 2 |
The key parameter data we examine are as follows. Plasma data are from the SWE (Wind) and from the LEP instruments (Geotail). Magnetic field data are obtained from MFI and MGF instruments [e.g., Kokubun et al. 1992; Lepping et al. 1995; Mukai et al., 1992; Ogilvie et al., 1995].

|
| Figure 3 |
The magnetic cloud arrived at Wind at approximately 1900 UT on 18 October 1995, preceded by an interplanetary shock at ~1040 UT. The magnetic field turned abruptly and strongly southward when Wind entered the magnetic cloud, and it rotated gradually to a northward orientation during the next ~24 hours. The magnetic field strength in the cloud was large (20-30 nT) and relatively constant. Note the relatively constant bulk speed in the cloud. The magnetosonic Mach number in the cloud is very low (between 2 and 4), which is ideal to check the position of the bow shock because this is precisely the range where in MHD theories the standoff distance starts to increase.
Solar wind dynamic pressure is high in the cloud's sheath and very low inside the cloud with a gradual increase from ~1 nPa up to ~10 nPa. This increase is mainly due to the interaction with a faster trailing stream [Farrugia et al., 1998].
Most of the time
pdyn is below the historical average of 2.2 nPa.
The interplanetary parameters provide an
ideal situation to examine the bow shock position
as a function of low magnetosonic Mach
number and under a wide range of dynamic pressure from
0.2
In a statistical analysis,
Farris et al. [1991]
studied 351
independent bow shock
crossings and 233 independent magnetopause crossings made by the ISEE 1
spacecraft
from 1977 to 1980 to determine the average positions and shapes of the bow shock
and the magnetopause. They represented the bow shock as a
paraboloid and obtained statistically
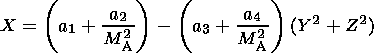
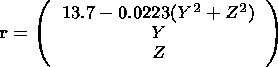
X=as-bs(Y2+Z2)
and
as=13.7
Specifically for low Alfvén Mach numbers,
Farrugia et al. [1995]
derived a
quasi-linear
connection between the thickness of the magnetosheath
Dms normalized
to the subsolar radius of the magnetopause
amp ( Dms (as-amp)/a
mp ) and the inverse square of the Alfvén
Mach
number,
1/MA2, as it is in our study.
Therefore, ignoring the motion of the bow shock, we fit the
crossings to the
Farris et al. [1991]
formula to a functional form which
brings
out the
1/MA2 dependence explicitly. Instead of two parameters,
as and
bs,
in the Farris formula, a four-parameter formula is employed:
Least squares fitting yields
a1=13.37,
a2=12.97,
a3=0.005, and
a4=0.036.
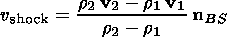
We employ two different methods of calculating the bow shock
normals:
(1) from the shape of the Farris et al.
bow shock and
(2) from the coplanarity theorem
[after
Abraham-Shrauner and Yun, 1976].
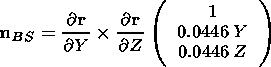
For method (1) we know the position vector
r of the boundary
Thus the shock normal vector at any point at the curve can be derived
from
vector analysis
For the shock normal derived from the coplanarity theorem we compute
upstream and downstream values of the magnetic field and obtain
where subscripts 1 and 2 refer to upstream and downstream values
of
In Figure 7
we plot for each interval
the angle
l between the derived shock
normals and the subsolar line, also for each method.
The observed normal directions have large scatter, which however
decreases
in groups 2 and 3, i.e., as Geotail approaches the subsolar line. The large
scatter of the coplanarity normals in group 1 (at the flanks of
the bow shock) may be due to localized disturbances on the shock
and hint to a more fluttery shock shape at the flanks.
The last group, where the scatter is small still has
Dl= 4.6o.
This may indicate that the actual bow
shock shape departs from an axisymmetrical shape, what may be due
to the large
By component of the cloud field at this time.
The angles
q between the shock normals and the
IMF
Bn at each bow shock
crossing are all
q>45o, and thus all shock crossings
are perpendicular shocks.
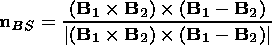
Now we use the coplanarity normals to derive the bow shock
velocity after
Burgess [1995]
The magnetosonic Mach number is very low at
times of shock in and out motions,
between 1.2 and 3.
The trend for large sunward displacement for decreasing
Mms is evident
here.
It has been shown in previous studies
[e.g.,
Cairns and Grabbe, 1994;
Cairns and Lyon, 1995, 1996;
Cairns et al., 1995;
Fairfield, 1971;
Farris et al., 1991;
Formisano et al., 1971;
Grabbe, 1997;
Peredo et al., 1995]
that at very low Alfvén
and magnetosonic Mach numbers the subsolar distance
could increase up to 30 or more
RE.
Note, however,
that we never observe a static bow shock but one moving
either earthward or sunward.
We now discuss the dynamic pressure.
For an increasing dynamic pressure, the magnetopause standoff distance moves
inward, as does the bow shock. We assume here that
this is the primary effect of dynamic pressure. We shall therefore not study
changes of the shape of the magnetosphere (blunt to more pointed), which rapid
and large dynamic pressure changes may be expected to occasion; that is,
we shall consider in first approximation only changes in dynamic pressure,
which are slow, i.e., which affect the whole magnetosphere.
The crossings are obviously correlated with changes in dynamic pressure.
When the dynamic pressure is low and
<1 nPa,
there are no crossings at all;
that is, the
Mms and the
pdyn effects on the bow shock position
act in the same direction.
Much work has been done on
the bow shock standoff distance as a function of interplanetary
parameters
[see e.g.
Grabbe and Cairns, 1995, and references therein].
In recent years there is renewed interest on this issue for cases when the
Alfvén Mach number is low
[Cairns and Grabbe, 1994;
Cairns et al., 1995;
Russell and Petrinec, 1996a, 1996b].
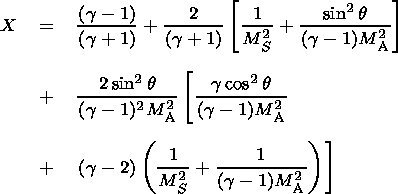
In their paper,
Grabbe and Cairns [1995]
present an analytical MHD formula for
the density jump
r2/r1=X
Because of the perturbation technique used to derive this formula,
it is valid only for values of
q
with
An empirical relation between the bow shock standoff distance
( as ), the magnetopause nose ( amp ), and
X takes the following
form
[Cairns and Lyon, 1995;
Farris and Russell, 1994;
Seiff, 1962;
Spreiter et al., 1966]
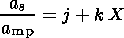
For the gas dynamic empirical relation found by
Seiff [1962]
and further
developed by
Spreiter et al. [1966],
j=1 and
k=1.1, where the value of
k depends on the obstacle shape. In the model presented by
Farris and Russell [1994]
the value for
k is modified at lower Mach
numbers by
k=1.1Mms2/(Mms2-1),
while
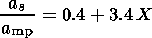
j stays at 1. In
the model developed from MHD simulations by
Cairns and Lyon [1995],
j=0.4 and
k=3.4 for quasi-perpendicular flows with
MS
using (6) and (7) for
X.
Figure 11 shows six panels where the first one contains the
predicted
as from (9) (solid line) and the given position dependent
on
MA,
keeping the dynamic pressure at its average value for the first group of
crossings.
In the second panel we keep the Mach number at its average value for the group of
crossings and check the effects of
pdyn through parameter
amp in
(9). The other four panels repeat this procedure for the other two
groups of crossings. The most impressive thing which can be made
out of this figure is that it seems that especially for the large
upstream
excursions of the bow shock,
MA influences the bow
shock motion most. Of course, when looking at the solar wind
parameters, this is an unexpected result, because of fairly
constant values of
B and the proportionality of
pdyn and
MA via the solar wind density and bulk speed
( MA2=m0rvsw2/B2=m0pdyn/B2 ).
Two considerations have to be taken into account when analyzing this figure:
(1)
as is calculated in subsolar distance, and our crossings
are
not subsolar; (2) to derive the nose of the magnetopause, we have
used the formula for pressure balance, which might not give the
most realistic behavior of the magnetopause for this event.
The very large, negative
Bz
From the figure we can see that for the first period, where we have
very negative
Bz, the Cairns and Lyon formula and the Shue et
al. formula fit quite well; and in the third period with positive
Bz, the Farrugia et al. magnetopause leads to rather good
agreement with Grabbe and Cairns.
1. We examined 26 repeated crossings of the bow shock on
18-19 October 1995, made by Geotail.
2. The period studied corresponded to an Earth passage of an
interplanetary magnetic cloud.
3. We related these crossings to interplanetary parameters,
the solar wind dynamic pressure, and the solar wind Alfvén
and
magnetosonic Mach numbers. For the interval studied,
the ranges of these parameters were
1
4. Compared to the model bow shock of Farris et al., we find a net
average sunward displacement of 1.85
RE due to the low Alfvén
Mach number.
5. We calculated the bow shock normals in two different ways and found
that the
coplanarity normals agree with the Farris et al. shape normals except near
the flanks, where
a wide scatter in the derived normals is observed.
6. All bow shock crossings were quasi-perpendicular,
qav
7. Small density jumps at bow shock occurred in association with low bow
shock speed (of the order of 20 km s
-1 ).
8. We examine a delay in the response time
of the bow shock between
Mms and
Pdyn changes
at Geotail and the bow shock crossings. This delay was of the order of
~10-20 min.
9. Our results are in fair agreement with the simulations of Cairns and
Lyon on the standoff
bow shock position in relation to
Mms.
10. We compare the position of the magnetopause and bow shock as predicted by
various models and
offered reasons for discrepancies between them.
11. The drawing
of any conclusions due to the extreme conditions of the interplanetary
magnetic field should also have been part of bow shock observations in this
special magnetic cloud event.
As seen from the data plots, there was strong negative
Bz for a long period then rotating
to the northward direction,
also a strong eastward
component rotating to strong westward values.
However, reconnection might occur, the
magnetopause could be eroded, and
asymmetries in the Earth magnetosphere could
play a nonnegligible role.
This we point out in Figure 13,
comparing the
as/amp values in
the first panel when
Bz was less than zero. In this panel the
result of the Cairns and Lyon model agrees rather well with the
Shue et al. formula, which takes into account the direction of
Bz. The pressure balance results show much lower values.
Vice
versa in the third panel with
Bz>0, the
as/amp derived from
the actual SW characteristics fit better with pressure balance
than with Shue et al.
Further work will be reported elsewhere
[Farrugia et al., 2001].
Abraham-Shrauner, B., and S. H. Yun,
Interplanetary shock seen by
Ames plasma probe on Pioneer 6 and Pioneer 7,
J. Geophys. Res., 81, 2097, 1976.
Burgess, D., Collisionless Shocks, in
Introduction to Space Physics,
edited by M. G. Kivelson and C. T. Russell, Cambridge Univ. Press,
New York, 1995.
Burlaga, L. F., Wind-Geotail magnetic cloud event:
Summary October 18-20, 1995
(Days 291-293),
http://bolero.gsfc.nasa.gov/~solart/cloud/summary.html,
1995.
Burlaga, L. F., E. Sittler, F. Mariani, and R. Schwenn, Magnetic loop
behind an interplanetary shock: Voyager, Helios, and IMP 8 observations,
J. Geophys. Res., 86, 6673, 1981.
Burlaga, L. F., et al.,
A magnetic cloud containing prominence material: January 1997,
J. Geophys. Res., 103, 277, 1998.
Cairns, I. H., and C. L. Grabbe, Towards an MHD theory for the standoff distance
of Earth's bow shock,
Geophys. Res. Lett., 21, 2781, 1994.
Cairns, I. H., and J. G. Lyon, MHD simulations of Earth's bow shock at low
Alfvén Mach numbers: Standoff distances,
J. Geophys. Res., 100, 17,173, 1995.
Cairns, I. H., and J. G. Lyon, Magnetic field orientation effects on the
standoff distance of Earth's bow shock,
Geophys. Res. Lett., 23,
2883, 1996.
Cairns, I. H., D. H. Fairfield, R. R. Anderson,
V. E. H. Carlton, K. I. Paularena,
and A. J. Lazarus, Unusual locations of Earth's bow shock on September
24-25, 1987: Mach number effects,
J. Geophys. Res., 100,
47, 1995.
Fairfield, D. H., Average and unusual locations of the Earth's magnetopause
and bow shock,
J. Geophys. Res., 76, 6700, 1971.
Farris, M. H., and C. T. Russell,
Determining the Standoff Distance of
the Bow Shock-Mach Number Dependence and Use of Models,
J. Geophys. Res., 99, 17,681, 1994.
Farris, M. H., S. M. Petrinec, and C. T. Russell, The thickness of the
magnetosheath: Constrains on the polytropic index,
Geophys. Res. Lett., 18, 1821, 1991.
Farrugia, C. J., N. V. Erkaev, H. K. Biernat, and L. F. Burlaga,
Anomalous magnetosheath properties during Earth passage of an interplanetary
cloud,
J. Geophys. Res., 100, 19,245, 1995.
Farrugia, C. J., et al.,
Geoeffectiveness of three Wind magnetic clouds:
A comparative study,
J. Geophys. Res., 103, 17,261, 1998.
Farrugia, C. J., et al.,
The bow shock on 18-19 October 1995,
J. Geophys. Res., in press, 2001.
Formisano, V., P. C. Hedgecock, G. Moreno, J. Sear, and D. Bollea,
Observations of Earth's bow shock for low Mach numbers,
Planet. Space Sci., 19, 1519, 1971.
Grabbe, C. L., Low Mach number predictions in an extended axially symmetric
MHD theory of the magnetosheath,
Geophys. Res. Lett., 24, 2495, 1997.
Grabbe, C. L., and I. H. Cairns, Analytic MHD theory for Earth's bow shock at
low Mach numbers,
J. Geophys. Res., 100, 19,941, 1995.
Kokubun, S., et al.,
Magnetic field measurement (MGF), in
Geotail Prelaunch Report, SES-TD-92-007SY,
pp. 58-70,
Inst. of Space and Astronaut. Sci., SES
Data Cent.,
Tokyo, Japan,
1992.
Lepping, R. P., J. A. Jones, and L. F. Burlaga, Magnetic field structure of
interplanetary clouds at 1 AU,
J. Geophys. Res., 95, 11,957, 1990.
Lepping, R. P., et al.,
The Wind magnetic field investigation,
Space Sci. Rev., 71, 207, 1995.
Lepping, R. P., et al.,
The Wind magnetic cloud and events of October 18-20, 1995:
Interplanetary properties and as triggers for geomagnetic activity,
J. Geophys. Res., 102, 14,049, 1997.
Mukai, T., S. Machida, N. Kaya, T. Terasawa, T. Obara, A. Nishida,
M. Ejiri, M. Hirahara, and Y. Saito, Low energy particle experiment
(LEP), in
Geotail Prelaunch Report, SES-TD-92-007SY,
pp. 97-125,
Inst. of Space and Astronaut. Sci., SES
Data Center,
Tokyo, Japan,
1992.
Ogilvie, K. W., et al.,
SWE, a comprehensive plasma instrument
for the Wind spacecraft,
Space Sci. Rev., 71, 55,
1995.
Peredo, M., J. A. Slavin, E. Mazur, and S. A. Curtis, Three-dimensional
position and shape of the bow shock and their
variation with Alfvénic, sonic and magnetosonic
Mach number and interplanetary
magnetic field orientation,
J. Geophys. Res., 100, 7907, 1995.
Russell, C. T., and S. M. Petrinec, Comments on
"Towards an MHD theory for the
standoff distance of Earth's bow shock" by I. H. Cairns and C. L. Grabbe,
Geophys. Res. Lett., 23, 309, 1996a.
Russell, C. T., and S. M. Petrinec, Comments on "Unusual locations of Earth's
bow shock on September 24-25, 1987: Mach number effects" by
I. H. Cairns, D. H. Fairfield, R. R. Anderson,
V. E. H. Carlton, K. I. Paularena,
and A. J. Lazarus,
J. Geophys. Res., 101, 7677, 1996b.
Seiff, A., Gas dynamics in space exploration,
in NASA Space Publ., 24, 1962.
Shue, J.-H., et al.,
Magnetopause location under extreme solar wind conditions,
J. Geophys. Res., 103, 17,691, 1998.
Spreiter, J. R., A. L. Summers, and A. Y. Alksne, Hydromagnetic flow around
the magnetosphere,
Planet. Space Sci., 14, 223, 1966.
Geotail Observations
Figure 4 shows an overplot of Wind and Geotail data,
where the Wind data have been shifted by the average delay time
of ~43 min. From top to bottom the figure shows the
solar wind density (cm
-3 ), the solar wind bulk speed
(km s-1 ), the GSE
X,Y,Z components of the interplanetary magnetic
field (nT), and its strength (nT).
Geotail is initially in the solar wind when the sheath of the
cloud passes. When the cloud arrives,
Bz measured by Geotail (GT) suddenly
drops to a large negative value of about

Figure 4
 (-45) nT and the
bow shock moves outward and GT is located in the magnetosheath.
Each time GT is in the solar wind we can see good
agreement at the two spacecrafts, and vice versa when the bow shock
moves out and Geotail is in the Earth's magnetosheath. From the
measurements made by Geotail we can identify five different
periods of IMF and plasma behavior of the solar wind (Table 1), three
periods with
bow shock crossings, two without.
(-45) nT and the
bow shock moves outward and GT is located in the magnetosheath.
Each time GT is in the solar wind we can see good
agreement at the two spacecrafts, and vice versa when the bow shock
moves out and Geotail is in the Earth's magnetosheath. From the
measurements made by Geotail we can identify five different
periods of IMF and plasma behavior of the solar wind (Table 1), three
periods with
bow shock crossings, two without.
Shape and Location of the Bow Shock
 0.2RE
and
bs=0.0223 0.0003RE-1
for the subsolar standoff distance and the shape parameters,
respectively.
0.2RE
and
bs=0.0223 0.0003RE-1
for the subsolar standoff distance and the shape parameters,
respectively.
(1)
Figure 5 shows the trajectory of Geotail (dotted) in the
XY and
XZ plane approaching the subsolar line from the dawnside.
Crosses on this trajectory mark the 26 bow shock crossing as
seen by Geotail. The solid curve represents the
Farris et al. [1991]
bow shock, whereas the dashed curve shows our fitted bow shock.
With respect to the
Farris et al.
formula, our bow shock is, on average, displaced by 1.85
RE sunward.
If we consider the second period (Table 1) with its
unusually low and rather constant values of
Mms and
pdyn and no bow shock crossings, we may
conclude
that the bow shock must have been sunward of the orbit of Geotail.
Otherwise, crossings occur when either
pdyn and/or
Mms vary; see, for example, period 1 from
1900-2300 UT in Figure 3 in the bottom two panels.

Figure 5
Bow Shock Normals
(2) 
(3) 
(4)

Figure 6
Figure 6 shows the Farris et al.
bow shock shape and the normals,
mentioned above, averaged for the three periods of shock
crossings. The solid line normal refers to
calculation 1
and the
dotted line to
calculation 2, respectively.

Figure 7
Velocity of the Bow Shock
(5)
The velocities of the bow shock at each crossing are plotted
in
Figure 8.
Crosses and triangles mark whether the bow shock is moving
outward or inward. The first and the last group of crossings all have a
velocity of the order of ~250 km s-1, whereas the second
group has a large scatter and lower velocities down to
~20 km s-1, what is probably due to the small density jumps across
the bow shock during period 2 (see Geotail measurements in Figure 4).

Figure 8
Effects of Dynamic Pressure and Mach Numbers
In Figure 9 we superpose dynamic pressure, magnetosonic Mach number,
and
the magnetic field at Geotail
for the three sets of crossings. The figure shows
that there is a clear extra response delay of about 10-20 min,
for both inward and outward motion (see, e.g., rise of
pdyn at 2105
UT in the top panel and
at 3225 UT
in the middle panel). This is probably mainly due to
the delay for changes in
Mms and
pdyn seen at Geotail to
reach the bow shock and subsequently for the bow shock to cross the
Geotail position.
For outward motions it could be that
pdyn and
Mms change
slowly, and the bow shock approached Geotail without crossing it,
but it does
later after a further impulsive drop in magnetosonic Mach number.

Figure 9
 60o.
In our
case, where the average value of
q75o,
one has to
take a simplified solution also presented by
Grabbe and Cairns [1995]
60o.
In our
case, where the average value of
q75o,
one has to
take a simplified solution also presented by
Grabbe and Cairns [1995]
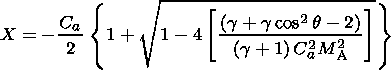
(6) 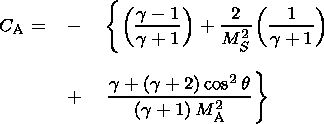
(7) 
(8) 8 and
MA>1.5. These values are appropriate for our
problem, and so we calculate the ratio
(9)

Figure 10
Figure 10 shows
as/amp during the passage of the cloud.
The
greatest value can be seen at about 2345 UT when Alfvén
Mach
number and dynamic pressure reach their lowest values. Compared
with the predictions of
Cairns and Lyon [1995, Figure 3]
our results
qualitatively agree fairly well in the studied range of
MA and
Mms, respectively.

Figure 11
(see Figure 12)
should lead to
magnetic field line reconnection and to an erosion of the
magnetosphere. Thus the magnetopause calculated from pressure
balance should be an overestimation of the true standoff distance.

Figure 12
For Figure 13 we plotted four different ratios
as/amp for the
26 measured bow shock crossings. The first one
repeats the Cairns and Lyon formula (9),
which takes into account the
plasma and magnetic field data measured by Geotail. For
the other three calculations the bow shock standoff
distance is taken from the Geotail crossings brought to the
subsolar line via the fitted bow shock shape described in (1).
For the magnetopause standoff distance we use various calculations,
which also underlay some restrictions, because
of our set of solar wind data.
In this way we combine actual measurements
with theory and models, respectively.
(1) Shue et al. [1998] (dotted line):
This is a numerical
formula that takes into account the possibility of erosion but is
also restricted in the range of negative
Bz

Figure 13
 -18 nT;
pressure balance (dashed line):
This simple formula ignores
Bz;
(2) Farrugia et al. [1995] (dashed dotted line):
The magnetopause is taken as a tangential discontinuity, which
precludes reconnection. On the other hand, the relation
was derived specifically for low Alfvén
Mach number.
The dependence of
the magnetopause thickness is normalized to
amp of
1/MA2,
which is an important feature in our study.
-18 nT;
pressure balance (dashed line):
This simple formula ignores
Bz;
(2) Farrugia et al. [1995] (dashed dotted line):
The magnetopause is taken as a tangential discontinuity, which
precludes reconnection. On the other hand, the relation
was derived specifically for low Alfvén
Mach number.
The dependence of
the magnetopause thickness is normalized to
amp of
1/MA2,
which is an important feature in our study.
Conclusions
75o.
Acknowledgments
This work is partially supported by the INTAS-ESA project 99-01277,
the Austrian "Fonds zur Förderung der wissenschaftlichen
Forschung" under projects P13804-TPH and P12761-TPH, by NASA grant NAG5-2834, by
grant 98-05-65290 from the Russian Foundation of Basic Research, by grant 97-0-13.0-71
from the Russian Ministry of Education, and by the Austrian Academy of Sciences,
"Verwaltungstelle für Auslandsbeziehungen."
References
Load files for printing and local use.
This document was generated by TeXWeb
(Win32, v.1.3) on January 27, 2002.