
A. L. Morozova and M. I. Pudovkin
Institute of Physics, St. Petersburg State University, St. Petersburg, Russia
P. Thejll
Solar-terrestrial Physics Division, Danish Meteorological Institute and Danish Climate Centre, Denmark
A number of works have been devoted to the study of solar activity's effect on atmospheric parameters in general and on atmospheric pressure in particular. These studies have shown the effect of long- (11-yr and 22-yr cycles, secular variations) and short-term (solar proton events (SPE), Forbush decreases of galactic cosmic ray (GCR) intensity, crossing of the interplanetary magnetic field (IMF) boundaries, etc.) variations of solar activity on lower atmospheric parameters, weather, and climate.
In particular, short-term (3-4 day) solar activity variations like SPE or Forbush decrease of GCR have a significant effect on air pressure in the stratosphere and troposphere, and even near the Earth's surface. Pudovkin and Veretenenko [1992] found a significant decrease of surface pressure in the middle- and high-latitude atmosphere and a small increase at low latitudes. The magnitude of these variations is about 1-2 hPa. These authors also studied Forbush decrease effects on the lower atmosphere. The results of their investigations have shown that on the third-fourth day after the Forbush decrease of GCR, the surface pressure in the middle- and high-latitude troposphere increases by up to 2 hPa. These results were obtained by analyzing zonal averaged pressure values. Also, there were some investigations dealing with grid data or station data (e.g., [Stolov and Shapiro, 1974; Zerefos, 1975]). These studies have shown that cells of surface pressure drop and rise are formed after SPEs or Forbush decreases.
If one looks at pressure variations after SPEs or Forbush decreases at other heights, the surface pressure changes are found to expand upward. In particular, Pudovkin et al. [1995] have found a strong decrease in pressure level heights, that is, a pressure decrease ( p = 1000, 900, 700, 500, and 300 mbars) in the mid-latitude troposphere associated with bursts of solar cosmic rays (SCR). The magnitude of these variations is about 50-100 gpm. In contrast, Forbush decreases of GCR intensity cause a rise of geopotential surface height, that is, a pressure increase, in the mid-latitude troposphere [Pudovkin et al., 1997] with amplitude of 60-120 gpm.
One part of our work is devoted to study of solar activity's effect (SPEs and Forbush decreases) on the height distribution of tropospheric pressure for high-latitude stations in the North-Atlantic region (Greenland, Denmark, Iceland, Faeroes, and Jan Mayen). Pressure variations in this region have been studied by some authors (e.g., Schuurmans [1981]; Stolov and Shapiro [1974]; and Thejll [1997]).
Schuurmans [1981] found a 500-mbar surface cell of drop near the North-Atlantic islands (Iceland, Faeroes) and two cells of 500-mbar surface rise after SPE. One of these rise cells is located above England, Denmark, and southern Sweden, and another is near the southern part of Greenland and the northeastern part of the Arctic Archipelago.
Zerefos [1975] found that on the first day after SPE in northwestern Greenland, heights of 500- and 300-mbar pressure surfaces decrease. In southern Greenland, these pressure surfaces slightly rise.
To continue all previous studies and improve previous results we investigated variations of pressure associated with bursts of SCRs and Forbush decreases of GCR for many meteorological stations at various latitudes and longitudes.
The dataset used in this work is a part of CDIAC's NDP-048/R1, "Six- and Three-Hourly Meteorological Observations from 223 USSR stations" database. This database was contributed by the All-Russian Research Institute of Hydrometeorological Information-World Data Centre (Obninsk, Russia) and prepared by the Carbon Dioxide Information Analysis Center in Oak Ridge National Laboratory, Environmental Sciences Division (Oak Ridge, Tennessee), as Publication No. 4771 [Razuvaev et al., 1993; Vose et al., 1992].
|
|
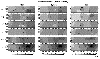
| Figure 1 |
 75oN and longitude range
l = 20 190oE.
Figure 1
presents the distribution of 223 station in the former USSR.
To study the variations of atmospheric pressure during
solar proton events or Forbush decreases of the
GCRs we have used the
air pressure
records
( p, expressed
in tenths of hPa) at station level measured at local noon. Values
of observations considered valid may range from 600.0 to 1100.0 hPa.
75oN and longitude range
l = 20 190oE.
Figure 1
presents the distribution of 223 station in the former USSR.
To study the variations of atmospheric pressure during
solar proton events or Forbush decreases of the
GCRs we have used the
air pressure
records
( p, expressed
in tenths of hPa) at station level measured at local noon. Values
of observations considered valid may range from 600.0 to 1100.0 hPa.
The variations of air pressure during SPEs or Forbush decreases
have been studied with the superposed epoch analysis for each of
the 223 stations. The dates of
SCR
bursts with
Ep  90 MeV and Forbush
decreases in galactic cosmic ray fluxes
larger than 2.5% during winter seasons have been used as "key
dates" (see Table 1).
Each event under consideration is isolated
from other events by at least 4 days.
90 MeV and Forbush
decreases in galactic cosmic ray fluxes
larger than 2.5% during winter seasons have been used as "key
dates" (see Table 1).
Each event under consideration is isolated
from other events by at least 4 days.

|
| Figure 2 |

|
| Figure 3 |

|
| Figure 4 |

|
| Figure 5 |
At first, all stations were divided into eight 5o latitude zones. Then the stations for each latitude zone were divided into a number of groups with similar pressure variation characteristics during SPEs or Forbush decreases. The average pressure variations associated with SPEs or Forbush decreases were calculated for each group. The results of these analyses as a departure from mean pressure level are presented in Figures 2, 3, 4, and 5.
To study the solar activity effect on height pressure distribution in the North-Atlantic region, we used a dataset provided by the Danish Meteorological Institute (DMI). This dataset contains selected data from the database of aerological soundings held at the DMI. These data include records of atmospheric pressure (expressed in hPa) height profiles for 10 stations (6 station in Greenland, Iceland, Faeroes, Denmark, and Jan Mayen) measured at local noon.
|
|
| Figure 6 |

|
| Figure 7 |
|
| Figure 8 |
To study the variations of air pressure during SPE or Forbush decrease, we have used changes of atmospheric pressure at some height levels. At first, all pressure profiles have been interpolated to a uniform height scale. Then, for each of the stations, we used the superposed epoch method to calculate the average effect of SPE or Forbush decrease on the altitude profiles of atmosphere pressure (see Table 1 for the "key dates"). Because of some numbers of data gaps, the number of analyzed events (both SPEs and Forbush decreases) depends on the station. The results of this analysis are presented in Figures 7 and 8 for three height levels ( h= 3, 5.5, and 9.5 km) as variations from mean pressure of each height level.
The results of some previous studies (e.g., Pudovkin and Veretenenko [1992]) have shown that on the second day after a SPE, the surface pressure at latitudes of 55o-70o N decreases by up to 1 hPa and at latitudes less then 55o N, the surface pressure increases by up to 0.5 hPa. The results presented in this paper make the longitude analysis of this zonal pressure variation possible. Figure 2 shows the averaged variations of surface pressure during SPE as a function of longitude and latitude. As one can see, SPE causes an appearance of increased and decreased surface pressure cells. The amplitude of pressure variations is about 5 hPa. The decreased cells are located in the continental part of the former USSR, and increased cells are located in regions with maritime climate.
Another interesting result of our investigation is the movement
of
surface pressure disturbances and their patterns from one station
(or group of stations) to another. The directions of these
movements are presented
by the
arrows
in Figure 3.
For all stations situated northerly than
j = 60 o N,
the pressure disturbances move eastward. The pressure
disturbances associated with SPEs move in a southeastern direction for
southern stations located west of
l 50oE
and in southerly and southeasterly directions for stations located east
of
l 50oE.
50oE
and in southerly and southeasterly directions for stations located east
of
l 50oE.
We can compare our data with results of other
investigations.
Zerefos [1975]
studied variations of
air pressure for different geopotential heights
in North America. He found a serious drop of isobaric surfaces in the
polar and subpolar atmosphere
( j 50oN) and a rise
of more southern stations. These data have been confirmed by
Schuurmans [1981].
He also found longitudinal cells of
drops and rises of the
500-mbar
isobaric surface.
In our study, we found that in the east
(20oE
 l 50oE)
and the west
(140oE
l 190oE)
regions of the former USSR, surface pressure
increases for all latitudes. In the middle region
(50oE
l 140oE),
there is a pressure decrease in
the
50o-65oN
latitude belt.
These data allow us
to conclude that for the continental part of Russian Eurasia, our
results are in good agreement with previous
results. For the eastern and
western parts of Russian Eurasia, our results contradict Zerefos's
data. This contradiction can be associated with ocean and oceanic
cyclone effects. Concerning the appearance of longitude cells of
pressure's decrease or increase, our results roughly agree
with Schuurmans's data, which can be associated with the difference
between pressure levels under consideration (500 mbar in
Schuurmans's work and
l 50oE)
and the west
(140oE
l 190oE)
regions of the former USSR, surface pressure
increases for all latitudes. In the middle region
(50oE
l 140oE),
there is a pressure decrease in
the
50o-65oN
latitude belt.
These data allow us
to conclude that for the continental part of Russian Eurasia, our
results are in good agreement with previous
results. For the eastern and
western parts of Russian Eurasia, our results contradict Zerefos's
data. This contradiction can be associated with ocean and oceanic
cyclone effects. Concerning the appearance of longitude cells of
pressure's decrease or increase, our results roughly agree
with Schuurmans's data, which can be associated with the difference
between pressure levels under consideration (500 mbar in
Schuurmans's work and
 1000 mbar in our case).
Figure 7 shows pressure variations caused by bursts of energetic protons from SCR at three height levels for the North-Atlantic region. One can see that the effect of the SPE is not uniform in the region under consideration. There are cells of pressure increase and pressure drop. These cells are similar for all three heights.
The main effect of the SPE on pressure in the North-Atlantic region at h = 3 km on the zeroth-first days is the production of a pressure drop cell in the oceanic part of this region (east coast of Greenland, Jan Mayen, Faeroes, Iceland). In the west (west coast of Greenland) and east (Denmark) part of the region under consideration there are cells of pressure rise. This pattern is repeated (in main) at height levels h = 5.5 and 9.5 km.
On the second day after the SPE, the cell of pressure drop moves westward and becomes smaller. It now covers only the east coast of Greenland. On the other side, the east cell of pressure increase also moves westwardly and expands to the region of the North-Atlantic islands (Jan Mayen, Faeroes, Iceland).
On the third day, the west cell moves north, and during the fourth through fifth days, it expands across the whole region under consideration.
Thus, the SPE's effect on pressure variations in the North-Atlantic region on the zeroth-third day is a pressure decrease in the oceanic part and an increase in the northwest and southeast part of this region. On the fourth-fifth day after the SPEs, the pressure in the region increases.
Our results are in good agreement with the data of
Schuurmans [1981].
We also have found that on the first day after
the SPE, at the height 5.5 km, pressure rises in the longitude ranges
0 l 15oE and
290oE (70oW)
l 320oE
(40oW)
and falls in the longitude
range
320oE
(40oW)
l 340oE
(20oW).
Concerning the meridional pressure variations, we
also have found that (in main) the pressure falls in the middle
latitude troposhere ( j 65oN)
and slightly rises
(in average) at high latitudes
( j 65oN).
Our data also confirm results shown by Zerefos [1975]. On the first day after the SPE on the west coast of Greenland, at heights of 5.5 and 9.5 km, pressure falls down near Thule (4202) station (northwest of Greenland) and rises near the south Greenland stations (Narsarsuaq (4270) and Aasiaat (4220)).
One station used in this study, Thule (4202),
is located near the North magnetic pole. During the first
days after the SPE,
pressure at Thule increased
h = 3 and 5.5 km, and the pressure decreased at
h = 9.5 km. We can
compare these results with pressure variations observed after the SPE
near the south magnetic pole in the Antarctic.
Vovk et al. [1997]
found that after the proton flares in the region near
the south magnetic pole, atmospheric pressure increases near the
ground level, is almost constant at
h = 5 km, and decreases at
h 10 km. Thus, the pressure variations
associated with SPEs
are similar for the magnetic poles.
The results of some previous studies (e.g.,
Pudovkin and Veretenenko [1992])
show that on the third-fourth day after
Forbush decreases of GCR,
surface pressure in the latitude belt
j = 50 70
o N increases by up to 2 hPa. Here we
present the longitude analysis of this zonal variation.
Figure 4
shows the averaged variations of surface
pressure during Forbush decreases as a function of longitude and
latitude.
Figure 4 shows that after Forbush decreases of GCR, cells of pressure increases and decreases appear, but they are stretched longitudinally and the pressure variations have an inverse sign. The magnitude of pressure variations Dp = 7-8 hPa.
Figure 5 analyzes the movement
of surface pressure disturbance patterns from one of more stations
to another. Unlike the SPE effect, the surface
pressure disturbances associated with Forbush decreases mainly
move from north to south (and from south to north for the Far-East
region with
l 150 o
E). Theses movements are
presented in
Figure 5
by the arrows.
We can compare our results with investigations of
Stolov and Shapiro [1974].
They studied changes of 700-mbar contour
heights associated with geomagnetic disturbances and also found
cells of isobaric surfaces's rise and drop. Our data do not show
significant agreement with Stolov and Shapiro's results. This
disagreement could be caused by the different pressure levels under
consideration (700-mbar in Stolov and Shapiro's work and
1000 mbar in our case).
As with the SPE effect, we have found an increase of pressure in the North-Atlantic region at all three height levels under consideration on the first day after Forbush decrease (Figure 8). There is only one exception - it is a Danish station in the southeastern part of the North-Atlantic region. On the second day, two regions of pressure decrease are formed. One of them is near the east coast of Greenland and another is in the region of Denmark-Faeroes. Also on this day, two regions of pressure rise are formed. One of them is located near the west coast of Greenland and another is near Iceland. On the fifth day after the Forbush decrease, there are only two regions with pressure variations of opposite sign. The first one is the region of pressure rise located near Thule (4202) station. The second one is the cell of pressure drop situated near Jan Mayen (1001) and expanded from one side to Denmark and from the other side to the east coast of Greenland.
The patterns of pressure variation distribution in the North-Atlantic region are similar for different height levels.
Our results do not confirm data
presented by
Stolov and Shapiro [1974].
On the zeroth day after the
Forbush decrease, we also found a cell of pressure rise in the
longitude region
330oE (30oW)
l 350oE
(10oW),
but our data did not display a cell of
pressure decrease centered at
l 300 o
E
(60oW),
j 60 o
N.
Also, our results concerning the pressure variations associated with Forbush decreases for Thule (4202) station do not agree with Vovk et al. [1997] data for the south magnetic pole. We did not find in Thule data any sign of pressure fall associated with Forbush decreases, whereas pressure measured on Antarctic stations near the south magnetic pole fell on the first day after Forbush decreases.
Pudovkin, M. I., and S. V. Babushkina, Influence of solar flares and disturbances of the interplanetary medium on the atmospheric circulation, J. Atmos. Terr. Phys., 54 (7/8), 841, 1992.
Pudovkin, M. I., and S. V. Veretenenko, Variations of meridional profile of atmosphere pressure during geomagnetic disturbances, Geomagn. Aeron. (in Russian), 32 (1), 118, 1992.
Pudovkin, M. I., S. V. Veretenenko, R. Pellinen, and E. Kyro, Influence of solar cosmic ray bursts on the temperature of the high-latitude atmosphere, J. Tech. Phys., 36 (4), 433, 1995.
Pudovkin, M. I., S. V. Veretenenko, R. Pellinen, and E. Kyro, Meteorological characteristic changes in the high-latitude atmosphere associated with Forbush decreases of the galactic cosmic rays, Adv. Space Res., 20 (6), 1169, 1997.
Razuvaev, V. N., E. G. Apasova, and R. A. Martuganov, Daily temperature and precipitation data for 223 USSR stations, ORNL/CDIAC-56, NDP-040, Carbon Dioxide Information Analysis Center, Oak Ridge National Laboratory, Oak Ridge, Tennessee, 1993.
Schuurmans, K. I. E., Solar flares effect on atmosphere circulation, in Solar Activity, Weather, and Climate, edited by B. M. McCormac and T. A. Seliga, pp. 129-144, D. Reidel Publ. Comp., Boston, U.S., 1981.
Stolov, H. L., and R. Shapiro, Investigation of the response of the general circulation at 700 mbar to solar geomagnetic disturbance, J. Geophys. Res., 79 (15), 2161, 1974.
Thejll, P., A search for effects of external events on terrestrial atmosphere pressure: Cosmic rays, DMI Scientific Report 97-3, 10 pp., 1997.
Vose, R. S., R. L. Schmoyer, P. M. Steurer, T. C. Peterson, R. Heim, T. R. Karl, and J. K. Eischeid, The Global Historical Climatology Network: Long-term monthly temperature, precipitation, sea level pressure, and station pressure data, ORNL/CDIAC-53, NDP-041, Carbon Dioxide Information Analysis Center, Oak Ridge National Laboratory, Oak Ridge, Tennessee, 1992.
Vovk, V. Ja., L. V. Egorova, I. V. Moskvin, and V. A. Uljev, Effects of cosmic ray variations on characteristics of atmosphere pressure in the region of South magnetic pole, Geomagn. Aeron. (in Russian), 37 (3), 163, 1997.
Zerefos, C. S., Circulation changes in the free atmosphere during proton events associated with type IV radio bursts, Planet. Space Sci., 23, 1035, 1975.