International Journal of Geomagnetism and Aeronomy
Published by the American Geophysical Union
Vol. 1, No. 1, April 1998
Seasonal features of longitudinal changes of the daytime
midlatitude ionosphere of the
southern hemisphere
N. A. Kochenova
Institute of Terrestrial Magnetism, Ionosphere, and Radio
Wave Propagation, Troitsk, Moscow Region, Russia
Abstract
Introduction
Experimental Results
Discussion
Comparison With the UT Control Model
Conclusion
Acknowledgments
References
Abstract
Seasonal variations of the longitudinal behavior of
ionospheric parameters in the southern hemisphere and the role of
various factors in its formation are discussed. A comparison with
the UT control model shows that agreement is observed only in
winter. In summer and during equinoxes, the longitudinal variations
of the atmospheric neutral composition impact the longitudinal
variations of ne
below 700 km stronger than the wind.
Introduction
Longitudinal variations of the midlatitude ionospheric parameters
in the geographic or geomagnetic reference systems are usually
related to changes in the vertical component of the plasma drift
velocity due to the thermospheric wind
[ Challinor and Eccles, 1971;
Eccles et al., 1971].
The longitudinal effects in the southern
hemisphere have been studied by several authors, including studies
based on the data of the
European Space Research Observatory
(ESRO) 1
satellite for a period of high ( F10.7 = 150 ) solar
activity and ESRO 4 satellite data for a period of low
( F10.7 = 100 ) solar activity
[ Kohnlein and Rait, 1978]. Analysis of these
data has demonstrated strong longitudinal variations in the
electron concentration of the midlatitude ionosphere and strong UT
control of these variations. The maximum of sine-like variations is
observed at about 0700 UT. The UT control is interpreted in terms
of neutral wind effects. The horizontal neutral wind at middle
latitudes at 0200, 0900, 1500, and 2000 UT is directed to the west,
south, east, and north, respectively. Owing to the geometry of the
magnetic field, in the southern hemisphere the maximum drifts are
observed at longitudes of 285o, 30o, 120o, and 195o,
corresponding to a UT of 0700. Good agreement between the presented
scheme and the ESRO 1 and ESRO 4 data was found, and the UT control
model was created
[ Kohnlein and Rait, 1978]. The model describes
(taking corresponding approximating formulas and coefficients) the
ne longitudinal variations above
hmax
at various altitudes and
LT moments and in various seasons. In this paper the longitudinal
effect is considered on the basis of Intercosmos 19 satellite data
and is compared with the UT control model.
Experimental Results
 The Intercosmos 19 satellite was orbiting with an apogee of 500 km
and a perigee of 1000 km during a period of very high solar activity
in 1979 and 1980; the annual mean value of
F10.7
was 190 and
200. The topside sounding allows us to obtain not only the electron
concentration in the outer ionosphere, but also the parameters of
the F2 layer maximum as well. In this paper we consider only the
daytime longitudinal variations. The data for quiet days, when
local time was close to noon (1200-1300 LT), were used. There were
about 10 such days for each season. The data scatter is 15-20%.
The longitudinal behavior typical for the given time is seen on
every day. Specific days with typical diurnal behavior (December 6,
October 16, and June 18, 1980) were chosen for illustration and
comparison with the model.
For all three days the
F10.7
index was 200 and local time was 1300 LT. The longitudinal variations in
nmax,
hmax, and
ne at 45oS at altitudes of
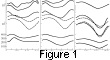
500 km and 700 km are shown in Figure 1 by solid lines.
Figure 1 shows that the
longitudinal variations in height in all three cases correspond
to the wind scheme described in the introduction. All the
hmax curves have maxima around 60o
and minima around 200o. As for
nmax and ne, the situation
in summer and during equinoxes
differs from that in winter. In summer and during equinoxes the
longitudinal variations have a small maximum at 60oE, but the
principal maximum is observed at 320oE and cannot be related to
the drift. Above hmax the longitudinal variations in winter and
during equinoxes are of a complicated character. At the altitudes
close to hmax the longitudinal behavior of
ne is similar in
to that of nmax; with an increase of altitude the
longitudinal behavior of ne
is transformed in such a way that it becomes more and more like the
longitudinal variation of hmax.
Unfortunately, in the cases considered the altitude of the
satellite did not exceed 700 km. One can only speculate that at
higher altitudes the longitudinal behavior of
ne would become completely similar to that of
hmax. On a winter day the
situation looks different. Here longitudinal variations of
nmax, n500, and
n700 are similar to those of hmax, but the
amplitude of the longitudinal variations at 500 and 700 km is
larger than that of nmax.
The Intercosmos 19 satellite was orbiting with an apogee of 500 km
and a perigee of 1000 km during a period of very high solar activity
in 1979 and 1980; the annual mean value of
F10.7
was 190 and
200. The topside sounding allows us to obtain not only the electron
concentration in the outer ionosphere, but also the parameters of
the F2 layer maximum as well. In this paper we consider only the
daytime longitudinal variations. The data for quiet days, when
local time was close to noon (1200-1300 LT), were used. There were
about 10 such days for each season. The data scatter is 15-20%.
The longitudinal behavior typical for the given time is seen on
every day. Specific days with typical diurnal behavior (December 6,
October 16, and June 18, 1980) were chosen for illustration and
comparison with the model.
For all three days the
F10.7
index was 200 and local time was 1300 LT. The longitudinal variations in
nmax,
hmax, and
ne at 45oS at altitudes of
500 km and 700 km are shown in Figure 1 by solid lines.
Figure 1 shows that the
longitudinal variations in height in all three cases correspond
to the wind scheme described in the introduction. All the
hmax curves have maxima around 60o
and minima around 200o. As for
nmax and ne, the situation
in summer and during equinoxes
differs from that in winter. In summer and during equinoxes the
longitudinal variations have a small maximum at 60oE, but the
principal maximum is observed at 320oE and cannot be related to
the drift. Above hmax the longitudinal variations in winter and
during equinoxes are of a complicated character. At the altitudes
close to hmax the longitudinal behavior of
ne is similar in
to that of nmax; with an increase of altitude the
longitudinal behavior of ne
is transformed in such a way that it becomes more and more like the
longitudinal variation of hmax.
Unfortunately, in the cases considered the altitude of the
satellite did not exceed 700 km. One can only speculate that at
higher altitudes the longitudinal behavior of
ne would become completely similar to that of
hmax. On a winter day the
situation looks different. Here longitudinal variations of
nmax, n500, and
n700 are similar to those of hmax, but the
amplitude of the longitudinal variations at 500 and 700 km is
larger than that of nmax.
Discussion
The F2 region maximum electron density is formed at the altitude
where the characteristic times of recombination and diffusion are
approximately equal; so the neutral composition plays an important
role in the formation of nmaxF2. In the MSIS 86 model
[ Hedin, 1987]
the neutral composition exhibits a well-pronounced
longitudinal variation in the geographic coordinate system.
Calculations of Kochenova and Shubin [1995] for summer conditions
with zero drifts show that the longitudinal variation of nmax
has a maximum at l = 280o,
that is, at the same longitudes where the minima of O2 and N2
and the maximum of O/N2 occur in the MSIS 86 model.
Further, all depend on wind velocity.
Maximum wind velocities are observed in winter. Only in winter
are the wind velocities
high enough to control the longitudinal
behavior of nmax. The fact that in winter the ionospheric impact
of the drift is maximum [ Badin, 1989] also contributes to the
effect. In winter the longitudinal variation of the neutral
atmosphere only smooths slightly the longitudinal variation of
nmax, and so the amplitude of the longitudinal change of
nmax is less than that of ne at
altitudes of 500 km and 700 km.
Contrary to that in summer, the longitudinal behavior of
nmax is
governed mainly by longitudinal changes of the neutral
composition in the geographic coordinate system.
The diffusion rate d and recombination coefficient
b vary in
opposite directions with an increase of altitude; so
b/d
rapidly decreases upward. The electron concentration above hmax
is described by the well-known expression
ne = nmax
(1-z-e-z), where
z = (h-hmax)/Hp
and Hp = K(Te +
Ti)/M(O+)g.
Figure 1 shows the
Hp values calculated from the
topside ne(h)
profiles for h = (hmax + 100 ) km. It can be seen
that Hp changes in the same way as hmax,
which means that the Hp variations are governed
by the layer vertical motion due to the
drift. Possibly there is some effect of the electron temperature
dependence on ne ( Te
 1/nea ),
but the effect is of second order. The Hp variations
explain the above mentioned deformation with height of the ne
longitudinal behavior. With an increase of height, the behavior should become
more and more similar to the longitudinal variation of
hmax, until the drift influence
exceeds that of the diffusion. Thus the longitudinal variations of
ne above
hmax contain complicated information on longitudinal
variations of nmax and hmax.
1/nea ),
but the effect is of second order. The Hp variations
explain the above mentioned deformation with height of the ne
longitudinal behavior. With an increase of height, the behavior should become
more and more similar to the longitudinal variation of
hmax, until the drift influence
exceeds that of the diffusion. Thus the longitudinal variations of
ne above
hmax contain complicated information on longitudinal
variations of nmax and hmax.
Comparison With the UT Control Model
From the above, it should be obvious that the UT control model
cannot adequately describe the longitudinal variations of the
electron concentration obtained on board the Intercosmos 19
satellite. Figure 1 shows the longitudinal variations of
ne
calculated by the UT control model. As could be predicted, there is
good agreement with the data only in winter. In summer and during
equinoxes the model neither quantitatively nor qualitatively
describes the observed longitudinal variations. It is difficult to
identify the reason for these discrepancies. Probably the
difference is that the model has been created on the basis of data
obtained during high solar activity ( F10.7 = 150 ), but the
Intercosmos 19 satellite operated during very high solar activity
(F10.7 = 200). Apparently, the influence of the longitudinal
variations of the neutral composition on the
nmax longitudinal
variations increases significantly in periods of very high solar
activity, with the influence of
nmax manifested up to satellite heights.
Conclusion
Analysis of Intercosmos 19 satellite data for very high solar
activity shows the following:
1. In summer and during equinoxes the longitudinal variations of nmax
are governed by the longitudinal changes of the neutral
atmosphere. As height increases, this control weakens and the role
of the wind increases.
2. In winter, nmax and ne
are governed by the wind. The
influence of the longitudinal variation of the neutral composition
only slightly decreases the amplitude of the
nmax longitudinal variation in comparison with that of
ne.
3. Agreement with the UT control model is observed only in winter.
Acknowledgments
This work was supported by the Russian Foundation
for Basic Research (project 94-05-17352).
References
Badin, V. I., Analytical dependence of the electron concentration
at the height of the daytime F2 layer maximum on the plasma drift
velocity and other aeronomical parameters,
Geomagn. Aeron., 29 (5),
795, 1989.
Challinor, R. A., and D. Eccles, Longitudinal variations of the
mid-latitude ionosphere produced by neutral-air winds,
I, Neutral-air winds and ionosphere in the northern and southern
hemispheres, J. Atmos. Terr. Phys., 33 (3), 363, 1971.
Eccles, D., J. W. King, and P. Rothwell, Longitudinal variations of
the mid-latitude ionosphere produced by neutral-air winds,
II, Comparison of the calculated variations of electron concentration
with data obtained from the Ariel 3 satellite,
J. Atmos. Terr. Phys., 33 (3), 371, 1971.
Hedin, A. E., MSIS 86 thermospheric model,
J. Geophys. Res., 92 (10), 4649, 1987.
Kochenova, N. A., and V. N. Shubin,
Longitudinal variations in the
summer ionosphere of the southern hemisphere,
Geomagn. Aeron., 35 (2), 155, 1995.
Kohnlein, W., and W. J. Rait, "ESRO 1" and "ESRO 4" a model of the
UT-effect in electron density at middle latitudes of the southern
hemisphere, Planet. Space Sci., 26 (12), 1179, 1978.
Load file for printing and local use.
This document was generated by TeXWeb (Win32, v.1.0) on December 13, 1997.